Opportunity analysis uses data to identify potential improvement initiatives and quantifies the value of these initiatives—both in terms of patient care benefits and financial impact. This process is an effective way to find unwarranted and costly clinical variation and, in turn, develop strategies to reduce it, improving outcomes and saving costs along the way. Standardizing the opportunity analysis process makes it repeatable and prioritizes actionable opportunities.
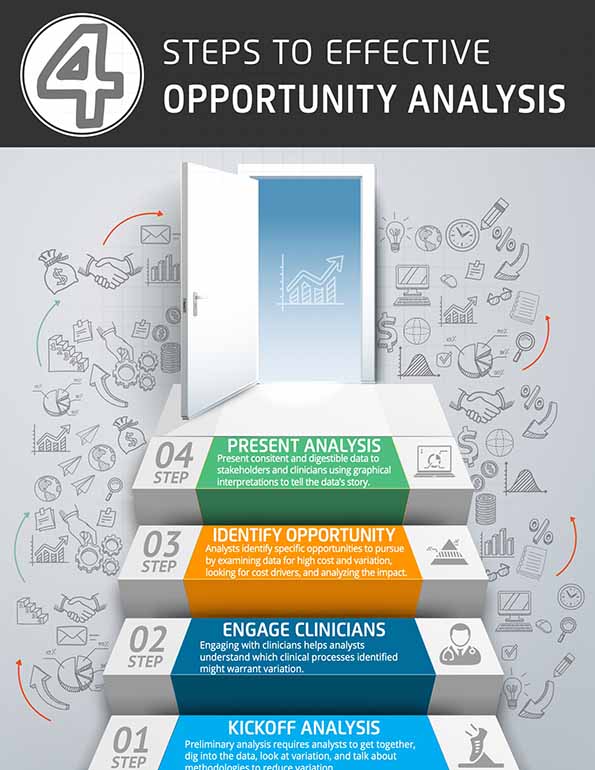
Quarterly opportunity analysis should follow four steps:
• Kicking off the analysis by getting analysts together to do preliminary analysis and brainstorm.
• Engaging with clinicians to identify opportunities and, in the process, get clinician buy in.
• Digging deeper into the suggested opportunities to prioritize those that offer the greatest benefits.
• Presenting findings to the decision makers.

This report is based on a 2018 Healthcare Analytics Summit presentation given by Matthew Brown, Finance Manager, Allina Health, and Sarah Jenson, Director, Analytics, Health Catalyst at Allina Health, entitled, “Reducing Unwarranted Clinical Variation Saves Tens of Millions of Dollars.”
It’s well known within the healthcare industry that variation in clinical care indicates waste, and waste has negative impacts upon care quality and cost. According to the Advisory Board’s 2017 report, Standardizing Practice for a Tighter Grip on Cost and Quality, unwarranted clinical variation accounts for 42 percent of wasted spending in U.S. healthcare. As healthcare reimbursement moves to a value-based model, health systems are under greater pressure to reduce clinical variation and related costs while improving patient outcomes. That’s not an easy task, but, fortunately, savings opportunities exist within every healthcare organization. Several studies show that for every $1 billion of revenue a typical health system has, there are approximately $30 million of actionable savings opportunities.
Slim margins and lack of resources in health systems require prioritizing improvement work, so some healthcare organizations are using data to identify opportunities and optimize improvement initiatives.
It’s one thing to know that variation is a problem; it’s another to know where the greatest unwarranted variation exists and what to do about it. Relying on traditional means to gather data, such as manual inspection of charts or billing records, doesn’t always lead to effective change initiatives because these methods are inefficient and fraught with human error.
Opportunity analysis is a systemwide process that uses data to identify opportunities for improvement and quantifies the value of proposed improvement initiatives in terms of optimized care, increased revenue, and decreased costs. It gives health systems a look at performance on a patient, clinician, and system level. Using data analytics tools, health systems can get a high-level look at opportunities for change and an in-depth look at how to improve outcomes and financials in a prioritized approach.
Identifying clinical variation is a challenging process. It takes time and effort to look at data and assess where the opportunities to drive improvement lie. Standardizing the opportunity analysis process makes it more repeatable than an ad hoc analysis and prioritizes actionable opportunities for cost savings and care improvements.
Analysts recommend engaging in opportunity analysis every quarter. While organizations can customize their approach, an opportunity analysis process should involve four basic steps: kicking off the analysis, engaging with clinicians to identify opportunities, digging deeper into those opportunities, and presenting findings to the decision makers using standardized visualizations of the data.
Kicking off an opportunity analysis involves getting all analysts together to select and assign areas of focus, which might include service lines, facilities, types of services or events, literature reviews, or a specific area of interest. The second part of this step is to filter down those focus areas to improvement ideas and do some preliminary analysis before engaging with clinicians to validate the ideas uncovered in the initial analysis. Improvement ideas can come from anywhere—nurses, clinicians, research articles, experience, etc. Once ideas are laid out, preliminary data analysis begins.
Preliminary analysis requires analysts to get together, dig into the data, look at variation, and talk about methodologies to reduce variation. Doing this well requires trained analysts and the right data analysis tools. Preliminary analysis uncovers insights for possible improvements, which are invaluable when engaging with clinicians, the next step.
Clinician and executive backing are imperative for change initiatives. Providing actionable data to clinicians engages them in the quest for improvement. A compelling story that provides support for improvement initiatives shows them the value of a data analysis investment.
Engaging with clinicians also helps analysts understand which clinical processes identified might warrant variation. Working early on with clinicians to validate opportunities for improvement makes the data more actionable later in the process because the team won’t spend valuable time and resources working on, for example, reducing variation that is warranted.
Once the team has decided upon the areas to investigate, it’s time for the analysts to do what they do best. They look at how to take what they’ve learned and identify which specific opportunities should be pursued.
Opportunities for improvement within health systems abound, making it difficult for analysts to identify the best options to present to decision makers, but following these guidelines for approaching the data helps:
The last step of the opportunity analysis is to present the findings to the stakeholders and clinicians. Before analysts make presentations to teams throughout the organization, it’s important they are on the same page so there is continuity in the messages. Presentations should be both consistent and digestible, which helps analysts explain what they found in the data and helps others understand those insights.
When presenting the results of an opportunity analysis, analysts should use standard graphical interpretations to tell the data’s story. When talking about clinical variation, several visualization types present data well:
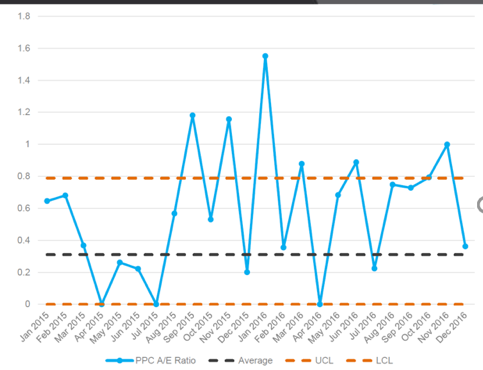
Control charts – A control chart illustrates variation in overall care and the variation over time, highlighting areas out of control. For example, data points going above the upper control limit, as seen in Figure 1, indicate that care delivery is inconsistent and warrants closer examination. If something is out of control, it provides a starting point for analysis, and the chart is a good visualization to show leaders the variation and thus the opportunity for improvement.
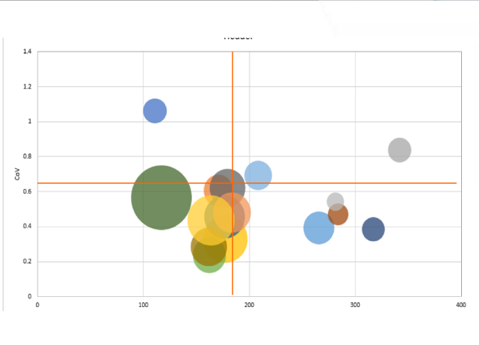
Bubble graphs – Bubble graphs highlight volume, cost, and variation within each location or providers. They should be used in conjunction with control charts. On the bubble graph, the x axis represents cost and the y axis represents the coefficient of variation. The size of the bubble represents volume (the larger the bubble, the greater the volume). The upper right quadrant of the bubble graph shows providers with high cost and high variation; these are often the best providers to investigate for improvement opportunities. The lower right quadrant gives good information as well because the bubbles represent providers with consistently high cost. The left quadrants represent providers with lower cost. These may be the best practice providers who have good insights to share.
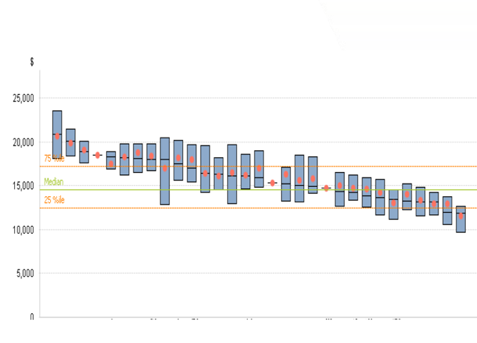
Box plots – Box plots highlight the range of variation within a location or provider, and the overall percentiles to make for easy comparison across categories. For example, providers above the overall 75th percentile indicate an opportunity for improvement.
After analysts present the opportunity analysis and the group agrees on improvement initiatives to further explore, the finance team should investigate these opportunities to understand the population and financial impact of any proposed action. Together, the finance team, the analysts, and care teams agree upon a set of assumptions based on a series of questions:
Finance takes these assumptions and creates a model to predict the impact to the bottom line. This prediction should consider four factors: revenue loss, increased bonus from payer (P4P), net gain, and improved outcomes.
Improving healthcare delivery and outcomes is a must for all health systems, and conducting quarterly opportunity analysis highlights areas that, so to speak, offer the most bang for the buck. Using data to perform an opportunity analysis is an effective way to begin rooting out and addressing unwarranted clinical variation, which in turn can save money while improving outcomes. When designing an opportunity analysis process, it’s important for analysts to remember the four key steps: kicking off with preliminary analysis, meeting with clinicians to gather input, digging deeper into the data for further analysis, and presenting to decision makers. Following these four basic steps and letting the data be a guide helps analysts identify and prioritize opportunities. With effective data analysis and engaged clinicians, organizations can find opportunities for improvement initiatives that reduce variation, save money, and improve care—all successes that benefit patients.
Would you like to learn more about this topic? Here are some articles we suggest:
Would you like to use or share these concepts? Download the presentation highlighting the key main points.