Control charts are a critical asset to any health system seeking effective, sustainable improvement. With a simple three-line format, control charts show process change over time, including the average of the data, upper control limit, and lower control limit. This insight helps improvement teams monitor projects, understand opportunities and the impact of initiatives, and sustain improved processes.
Also known as Shewhart charts or statistical process control charts, control charts drive effective improvement by addressing three fundamental questions:
1. What is the goal of the improvement project?
2. How will the organization know that a change is an improvement?
3. What change can the organization make that will result in improvement?
 Download
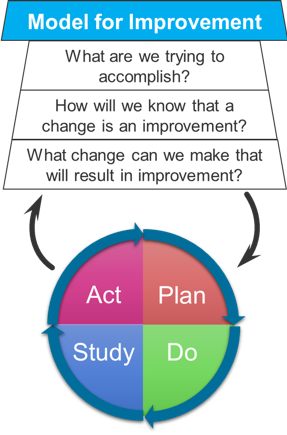
Editor’s Note: Measuring quality improvement in healthcare is important. Lloyd Provost shares how control charts help with that improvement work.
Healthcare improvement is complex work, from identifying opportunities for improvement to measuring the impact of interventions and understanding real causes of variation. Health systems can add structure and clarity to improvement work by using control charts to monitor projects, gain critical insight into opportunities, understand the efficacy of initiatives, and sustain improved processes over time.
In improvement initiatives, health systems can use control charts to support the Model for Improvement (Figure 1), a method for accelerating improvement, by addressing three fundamental questions:
After its three questions, the Model for Improvement applies the Plan-Do-Study-Act (PDSA) cycle (Figure 1), a framework for evaluating changes in a real work setting to determine if those changes result in improvement.
This article describes four ways control charts in healthcare can support successful improvement.
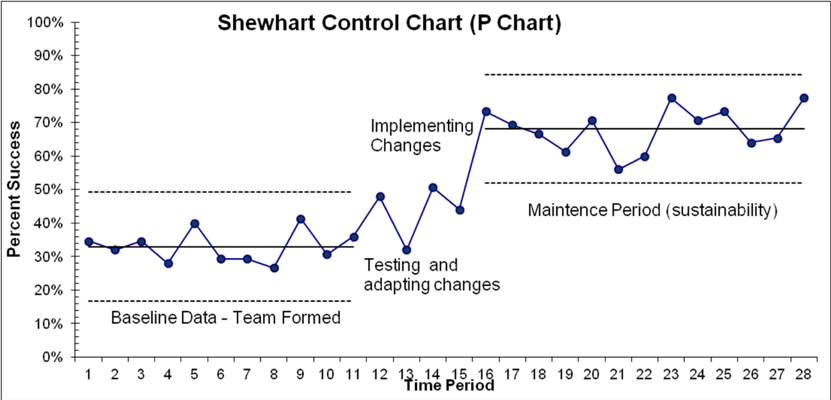
Control charts, also known as Shewhart charts (Figure 2) or statistical process control charts, help organizations study how a process changes over time. The charts plot historical data and include a central line for the average of the data, an upper line for the upper control limit, and a lower line for the lower control limit. Users compare current data to the lines to determine if the variation in a process is stable (only common cause variation) or unpredictable (some special cause variation).
According to the Shewhart concept of common cause and special cause variation, common causes are an inherent part of a system or process that impact all stakeholders and outcomes at all times; special causes arise from specific circumstances that impact only a subset of people or outcomes. During improvement initiatives, health systems can use the distinction between common and special cause variation to identify changes that will result in improvement and assess how effectively these changes improve a process.
Control charts help health systems measure healthcare processes and determine the strategy and scope for an improvement initiative. The control chart can help determine the focus of the next PDSA cycle in one of four areas:
For example, to improve the health of children with diabetes, a health system can use control chart principles to identify variation and opportunities for improvement in pediatric diabetes care. Their initial work might focus on the cost and care of patients admitted to the hospital with diabetic ketoacidosis (DKA). With control charts of the length of stay (LOS) for the last 30 DKA patients admitted, the improvement team can learn from the variation in the current process and optimize their improvement strategy. Insight from the control charts can help the team make a critical differentiation:
The control chart method provides a formal way to decide whether observed variation in a measure of quality is due to implemented changes or to other causes of variation in the system. Health systems can study this question at both the project level and in a PDSA test of change:
By monitoring the outcome and process measures throughout the life of the improvement project, improvement teams can understand the cumulative impact of the changes implemented. In the diabetes improvement scenario above, a control chart for weekly measures of average LOS and readmissions would be appropriate.
A special cause signal on a control chart in a PDSA test cycle can provide evidence that the change the improvement team is testing impacts a process or outcome measure. For example, the improvement team in the pediatric diabetes project might test the use of evidence-based changes to improve insulin timeliness. If the baseline control chart for time to administer insulin were stable, the improvement team would know they needed a process change to become timelier. They could study the current process and discuss ways to reduce the time for patients to receive insulin. By plotting timeliness for each patient, within a week of beginning to test these changes, the control chart would show signals of special cause, confirming the predicted improvement. The team could then implement the changes and continue to monitor the chart to hold the gain.
Control charts that use rational subgrouping and stratification can also help users study causes of variation to develop ideas for change. For example, if an improvement team theorizes that there are particular times of day when problems occur, they can subgroup the data on the applicable control chart time of day to evaluate this theory.
For example, if the pediatric diabetes improvement team were seeking ways to improve use of flu shots among patients with diabetes, they could use a control chart to study flu shot use for different age groups. A team member could use the control chart to show the percentage of patients who received flu shots and use this rational subgroup analysis to develop different strategies to reach pre-school and school-aged children.
Health systems can use control charts to understand the causes of variation in key measures and unlock understanding of effective improvement strategies, potential changes that result in improvement, and how effectively these changes improve a process. Organizations that routinely deploy control charts to monitor key process measures can charter effective improvement initiatives and expect to see an increase in the return on their investment in improvement.
Would you like to learn more about this topic? Here are some articles we suggest:
Would you like to use or share these concepts? Download this presentation highlighting the key main points.


