When healthcare leaders make data-driven decisions, they often think they see the same thing in the data and assume they’re drawing the same conclusions. However, decision makers often discover later that they were looking at the data differently and didn’t derive the same insights, leading to ineffective and unsustainable choices. Healthcare leaders can manage differing data interpretations by using statistical process control (SPC) methodology to find focus, avoid divergent data interpretations, make better decisions, and monitor change for a sustainable future. By deriving concise insights, SPC separates the signal from the noise, augmenting leaders’ decision-making capabilities.
 Download
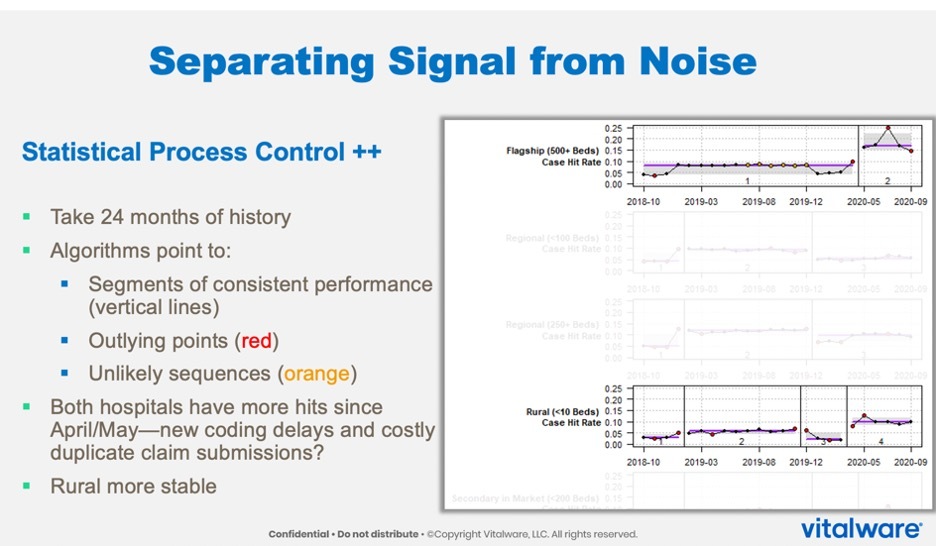
This article is based on a webinar presented by Jason Jones, PhD, Chief Data Scientist for Health Catalyst, and Adam Ziegel, Product Manager for Vitalware, titled, “Find Focus and Monitor Change with Augmented Intelligence.”
When healthcare leaders make data-driven decisions, they often think they see the same thing when looking at the data, assuming they’re drawing the same conclusions and are ready to take the next steps based on shared insights. However, decision makers often discover months later that they were looking at the data differently from each other and didn’t derive the same insights.
To manage differing data interpretations, healthcare leaders can use statistical process control (SPC), a statistical technique using tools and procedures to monitor process behavior, discover issues in internal systems, and find solutions. Statistical process control methodology can help decision makers find focus, avoid divergent data interpretations, make better decisions, and monitor change for a sustainable future.
Instead of approaching data-science-enabled decision making as artificial intelligence (AI), a tool to replace the human thought process, SPC helps data science users progress to augmented intelligence, a more dynamic view of data science. An augmented-intelligence perspective leverages technology’s top capabilities (e.g., math and memory) to enable human decision makers to make the best choices for their patients and organizations.
Via SPC, an augmented-intelligence approach helps leaders make better decisions in two meaningful ways:
Augmented intelligence helps decision makers find focus by separating the signal from the noise, meaning drawing meaningful information from unwanted variation or fluctuation, enabling leaders to find focus on aggregate data. For example, if one hospital is performing better than another or if health system leaders set and evaluate an improvement goal, augmented intelligence via SPC can identify which data is within the normal realm of fluctuation (noise) and which variation denotes superior or lesser performance (signal).
By nature, data is historical, making it natural for leaders to use data to look back rather than forward. Decision makers must also bear in mind focusing on the future and using data to monitor change—forecasting where their organizations will be in a year, whether they like that projection, and, if not, what they can change. And if decision makers are satisfied with the data-informed forecast, they must evaluate whether that performance is sustainable.
To separate the signal from the noise and monitor change, healthcare leaders must derive common insights from their data and determine the next steps together. The SPC methodology supports both goals by using control charts, which help organizations study how a process or metric changes over time.
For example, to separate the signal from the noise, a health system compares its case hit rate at a flagship hospital with 500-plus beds with another rural hospital with fewer than ten beds over time (Figure 1). Running SPC on this data, the health system identifies rates outside of its normal levels of variation and trend violations, or differentiation in patterns. The organization thereby determines outliers in their performance that may warrant extra attention. Also, an algorithm runs in the background of the SPC to determine if the organization has seen a shift in case hit levels between the rural hospital and the flagship hospital, according to the data.
The right-hand side of Figure 1 shows the actual data as they have come in over 24 months. Each red point on the graphs marks an outlier, a data point outside of what the organization considers normal variation and warrants attention. The orange points on the graphs denote trend violations that may merit investigating.
The most noteworthy insight from Figure 1 is an algorithm that runs in the background to determine if the data from the hospitals shows a shift in level. In this case, there are shifts in levels in the rural hospital and flagship hospital. The jumps in levels are the signal—the meaningful information—but what is it actually telling the decision makers? The shifts could be COVID-19 related and not from the encounters themselves, but digging deeper could reveal something separate from COVID-19, such as a coding delay. The role of SPC in such a scenario is to get down to what differentiates these two facilities from the others, giving decision makers a uniform insight.
Another control chart, a forest plot, can help users further derive consistent insights from aggregate data (Figure 2) and focus on the future. With this approach, users can see the trees in the forest and the forest as a whole. In Figure 2, the Y-axis on the left-hand side shows the hospital graphs that Figure 1 considers. The X-axis contains the values for the measure of interest—again, in this case, the revenue integrity case hit rate from July through September of 2020.
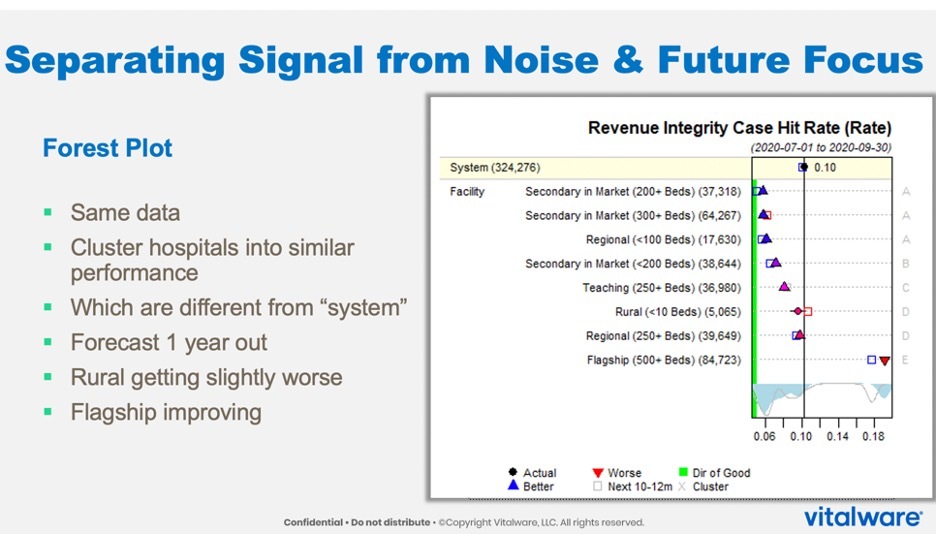
This forest plot shows how the system performs overall—at about a 10-percent revenue integrity case hit rate. There’s low variation (6 percent) with the secondary market hospital with 200 beds and another secondary hospital with about 300 beds and a regional hospital (both also about 6 percent), and so on.
If the individual points form an upward triangle, it means that the hospital is outperforming the system as a whole, which is this vertical line. A downward triangle indicates that a hospital is underperforming the others in the system. A circle means that, statistically, the hospitals are tied.
These insights immediately provide a performance picture of each hospital (the trees) and the system as a whole (the forest). In the example in Figure 2, the flagship hospital from Figure 1 is underperforming the rest of the hospitals in the system.
One limitation of forest plots is that viewers may question whether the triangles differ from each other. In response, an algorithm runs in the background of this analysis to provide letters on the far right indicating a three-way tie for top performance, statistically (letter A). Two hospitals have unique performance levels (B and C), and two more tie (D). Finally, E denotes a negative outlier, the flagship hospital.
By adding the performance information via the algorithm, the plot aids decision making by plainly demonstrating which hospitals are similar and which differ. From here, leaders are seeing the same output, not left to derive separate insights.
Figure 2 also contains squares that use history to represent where this hospital will be in a year—the future focus. This insight requires separating signal from noise to show decision makers which facility is different from the system instead of which hospitals are clustering together. This example shows signs of improvement among some hospitals, but others, despite being tied in this plot, are moving in different directions. The rural hospital looks to be trending a little bit worse, while the regional 250-bed hospital shows slight improvement signs.
By separating the signal from the noise and focusing on the future, SPC elevates leadership decision making to a more unified and sustainable process. Rather than replacing human judgment, SPC and related control charts clarify the data, providing succinct interpretations and predictions so that leaders can apply their expertise and skill sets directly to the problem at hand, versus losing precision due to divergent interpretations. With this methodology, SPC helps leaders leverage data science beyond artificial intelligence and on to augmented intelligence.
Would you like to learn more about this topic? Here are some articles we suggest:
PowerPoint Slides
Would you like to use or share these concepts? Download the presentation highlighting the key main points.
Click Here to Download the Slides
https://www.slideshare.net/slideshow/embed_code/key/4ihHbraiNzlkT4