Timely access to actionable data is critical for clinical, financial, and operational improvement in healthcare. In an attempt to motivate employees with data-informed improvement, this healthcare organization utilized visual management boards, manually posting printed graphs to boards on each unit quarterly, but long delays in data availability limited its effectiveness. The manual processes for preparing data and visualizations severely limited the number of shared outcome measures. Recognizing the need to change, the organization leveraged its analytics platform and a robust suite of analytics applications to make data available to all employees and accelerate organizational improvement capacity.
More than ever before, data are one of the most important components of healthcare quality, and timely access to actionable data is crucial for healthcare organizations.1 Visual management boards provide information about process improvement at a glance and can be a powerful tool for engaging frontline staff in quality improvement efforts. Combined with daily huddles, visual management boards can help teams review and organize the day and develop strategies to address complicated issues.2
This healthcare organization, comprised of a specialty hospital and multiple clinics, had attempted to engage the entire organization in data-informed improvement efforts. The organization shared quality data with frontline staff by utilizing visual management boards but delays in data availability limited effectiveness. To prepare data and visualizations, it printed graphs each quarter and manually posted them to boards on each unit. These paper copies were not engaging, and data were at least four months old by the time they were posted to the units. The burdensome manual processes required to prepare data and visualizations limited the number of shared measures resulting in each unit only sharing five to six outcome measures.
The organization understood that data were critical for clinical, financial, and operational improvement and wanted a solution that would allow it to make a multitude of performance data available across the entire organization, from the C-suite to frontline staff.
The organization leveraged the Health Catalyst® Data Operating System (DOS™) platform and a robust suite of analytics applications, including the Pop Insights™ analytics application and Healthcare.AI™, to make data available to employees, accelerating organizational improvement capacity. The organization uses the Pop Insights kiosk mode to push data hands-free to teams across the system. Teams can monitor measures asynchronously and collaboratively on any digital visual management board through the automated slideshow of dashboards. The kiosk remains logged in and cycling 24 hours a day, seven days a week.
The organization uses Healthcare.AI to integrate AI techniques into its analytics tools. Statistical process control (SPC) charts are automatically created by Healthcare.AI and updated each time the data refresh—as frequently as every 15 minutes.
The organization publishes displays to each inpatient unit, which are visible to its patients. The boards automatically filter to the specific unit’s performance data. When frontline staff reviews the displays, they see data specific to their unit and their day-to-day work. For example, nursing staff can quickly and easily visualize central line-associated bloodstream infection (CLABSI) bundle compliance for the last week and immediately see the impact of bundle compliance on CLABSI rates.
In addition to the unit-based displays, the organization implemented executive displays for its leadership team. The executive boards display performance data for the overall institution, and leaders can easily drill into specific data of interest. The organization regularly reviews data pushed to the boards, adding and archiving measures and ensuring alignment with strategic priorities.
The boards also enable organization-wide communication of important safety messages and celebration of unit achievements. The organization uses the boards to remind staff to get their COVID-19 and influenza vaccinations and reinforce key hand-hygiene messages. Recently, an inpatient unit achieved the notable accomplishment of having gone 365 days without a CLABSI. The organization recognized and celebrated this accomplishment and used the displays to push out photos of the staff who achieved these goals, congratulating them on this significant milestone.
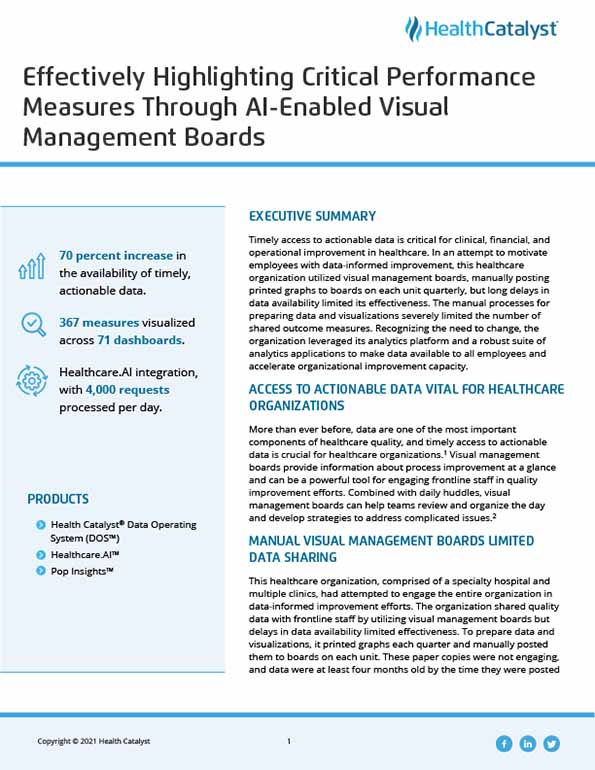
The organization has enabled a data-informed culture with continuous, automated visualization of critical measures. For the first time, it can visualize numerous outcome and process measures, providing everyone from the C-suite to frontline staff meaningful, timely, actionable data. Results include:
“Using DOS, Pop Insights, and Healthcare.AI has allowed us to rapidly expand the number of performance measures shared across the organization. The data are visualized in a consistent manner, helping to ensure the entire organization is using the same data and methods to understand and improve performance.”
- Director Clinical Improvement
The organization plans to expand its ability to quickly provide timely, accurate data, providing leadership and frontline staff the opportunity to learn from data and adjust processes to achieve the best possible clinical, financial, and operational outcomes.