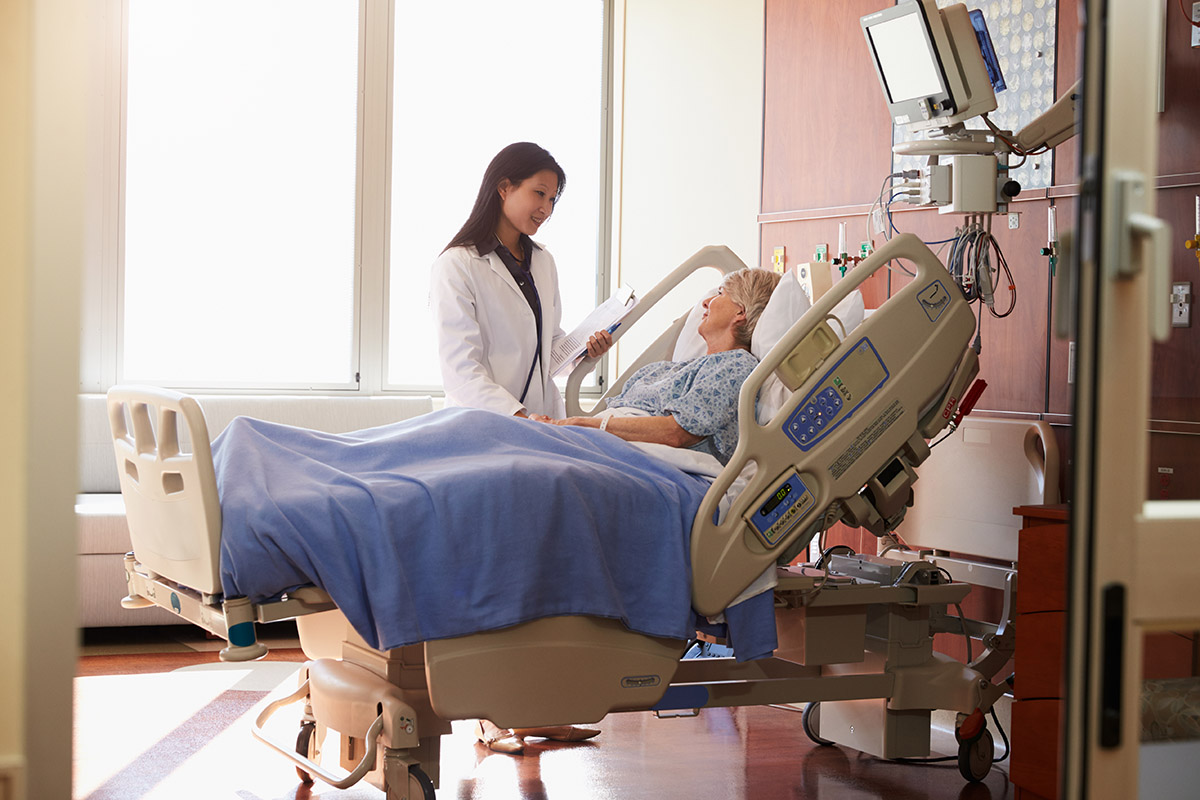
Medical errors are the third leading cause of death in the U.S., accounting for 10 percent of all deaths. Recognizing the danger to patients posed by medical errors, Allina Health is dedicated to improving the safety of the patients cared for at its facilities by learning from past adverse events, identifying and addressing root causes, and automating the identification of patients who may have been harmed or are at risk of harm.
To build upon previous efforts to improve patient safety, the safety committee at Allina Health selected two additional focus areas of concern for patient safety and proceeded to further analyze the data, identifying opportunities to use predictive analytics to predict, detect, and prevent potential harm.
Allina Health utilized its analytics platform, a trigger-based data-driven surveillance tool, and machine learning to identify and investigate a broader base of harm events.
In the U.S., medical errors now account for 10 percent of all deaths, making it the third leading cause of death.1 Allina Health is a large healthcare system centered around the Minneapolis/St. Paul area that includes four large metropolitan hospitals, eight smaller community hospitals, 85 clinics, 5,000 physicians, and approximately $4 billion in revenue. Recognizing the danger of medical errors, the organization is dedicated to improving the safety of the patients cared for at its facilities by learning from past adverse events, identifying and addressing root causes, and automating the identification of patients who may have been harmed or are at risk of harm.
Allina Health had previously instituted a patient safety committee responsible for patient and employee safety, and patient safety event monitoring and reporting, implementing the following strategies to improve patient safety:
After completing the Agency for Healthcare Research and Quality (AHRQ) Safety Culture Survey tool and establishing safety huddles, the committee had set up a pilot program to investigate patient safety surveillance in three areas: administration of ephedrine, emergency department (ED) or inpatient readmission within 30-days of surgical procedure, and partial thromboplastin time >130 after intravenous heparin administration.
The safety committee reviewed the findings from these initial pilots and decided that the next step should be to select two additional areas of concern for patient safety and further analyze the data, identifying opportunities to use predictive analytics to predict, detect, and prevent potential harm. Building on its experience with the Health Catalyst® Analytics Platform and broad suite of analytics applications and its experience in using the Health Catalyst Patient Safety Monitor™: Surveillance Module, Allina Health used a data-driven approach to determine the next two areas of focus.
Hospital-acquired pressure injuries (HAPIs) were one type of patient safety event Allina Health investigated due to HAPIs resulting in increased patient length of stay (LOS), between two and five times the typical LOS, and the added cost of healing the pressure injury ranging from $5,000 to $50,000.2 These findings, analysis of the incidence of pressure injury at Allina Health, and consultation with its subject matter experts, led to the selection of this as one of the next areas of focus.
Another type of patient safety event, healthcare-associated infections (HAIs) also remains a serious concern for hospitalized patients. Every day, nearly one in 25 patients in a hospital has at least one HAI, leading to negative outcomes that carry heavy financial costs and put patient health at risk.3 Central lines, commonly used in hospitals to administer IV fluids and allow for easier blood draws, are a common source of infections known as CLABSIs. Despite CLABSIs being largely preventable, problems with early identification and reporting make them an ongoing concern for hospitals. Allina Health selected CLABSI as its second area of focus for the next stage of improving patient safety.
The existing HAPI data at Allina Health was incomplete as it was mainly based on voluntary reporting, and there was inconsistent documentation among hospitals. In addition, most of the analysis focused on patients with a stage 3, stage 4, or unstageable pressure injury, as these categories of pressure injuries must be reported to the state. To obtain a true picture of the status of pressure injuries at its facilities, the safety committee at Allina Health needed information about all patients with a HAPI. Allina Health believed that creating an accurate predictive model for pressure injury surveillance would help protect patients more effectively.
Allina Health utilized its analytics platform, a trigger-based data-driven surveillance tool, and machine learning to identify and investigate a broader base of pressure injury events including events that were not reportable, as well as near misses. Using these solutions, the organization created a HAPI predictive model to determine a patient’s risk level and identify events and near misses for further investigation.
Triggering events were examined for potential harm, and then the reviewer followed a standardized review process for confirming the event and assigning harm severity and categories to each event. Patients were assigned a risk category based on predicted probability and the total Braden Score.
After review by the subject matter experts to update the logic, the final review of retrospective analysis showed the following:
The 333 potential events found by the trigger tool were reviewed to find that there were only a couple of additional cases that met the criteria to have been reported to the state. These additional all-cause harm cases, however, did uncover many opportunities to improve documentation and make the data output more accurate. This reinforces the belief that uncovering all HAPIs and near misses would enable Allina Health to make its patients safer.
The information from the additional cases was used to refine the logic to confirm adverse events so that the information could be used to support the next step of proactively identifying patients at risk in near real-time.
Consistent with the premise that you can’t improve what you can’t measure, the first challenge in improving CLABSIs was being able to identify which patients have a central line. Identifying and tracking patients with central lines can be difficult for a few reasons:
Allina Health had documented success in improving patient safety surveillance using patient safety triggers and had learned that proper, clear, consistent documentation of key variables was a necessary precursor to building effective triggers, which could eventually be used to build predictive models.
Improving CLABSI surveillance was identified as an opportunity for Allina Health to improve patient safety with predictive analytics. Allina Health had been using predictive analytics to improve a variety of outcomes, and leadership hoped to apply previous methods to bring about a successful CLABSI improvement initiative.
The approach taken for HAPI was to build the triggers first and then validate their effectiveness and predictive value for events by comparing the identified events against voluntary reporting. More efficient and complete chart review illuminated several improvement opportunities.
This approach worked well for HAPI because the available historical data was incomplete due to documentation issues and focused only on reportable events. Once the triggers were set up, machine learning was used to “train the model” to become more accurate as more events were confirmed and documentation was improved.
CLABSI was an example of an area where Allina Health had a lot of detailed data available due to reporting requirements. So, in this case, it was possible to start with clinically confirmed events for CLABSI and then review five years of retrospective data to help define the triggers.
Building on its experience with using analytics and machine learning to identify and investigate a broader base of harm events, Allina Health began to examine the variables that would be linked to CLABSI. The selection of the variables to run the triggers was guided by investigation of the literature, findings from other hospitals, and clinically confirmed events at Allina Health.
During this analysis, it was identified that there was a lot of missing documentation, particularly around removal date (missing 23 percent of the time), and insertion site (missing 21 percent of the time). Also problematic was that CLABSIs could not be easily attributed to a specific central line, and ten percent could not be easily attributed to a specific encounter. Therefore, efforts were taken at Allina Health to improve documentation of these data elements, recognizing that this would improve the identification of patients and the predictive capability of the model even more, leading to improved surveillance and early identification of patients at risk.
Allina Health utilized its analytics platform, a trigger-based data-driven surveillance tool, and machine learning to identify and investigate a broader base of harm events for HAPI and CLABSI. This approach enabled the organization to:
“By looking at pressure ulcer adverse events at a systemwide level we were able to identify trends and opportunities not previously noted in siloed spreadsheets.”
- Kassandra Ryan, MSN, RN, Quality Improvement Specialist, Allina Health
Allina Health believes that predictive analytics is key to identifying patients at risk, in addition to those harmed, and is moving forward with additional functionality. The organization plans to use the analytics application containing the HAPI predictive model in a pilot at two hospitals to provide feedback to the safety committee on how it can be used effectively and provide recommendations on how to spread and operationalize it to decrease HAPI cases across the health system.
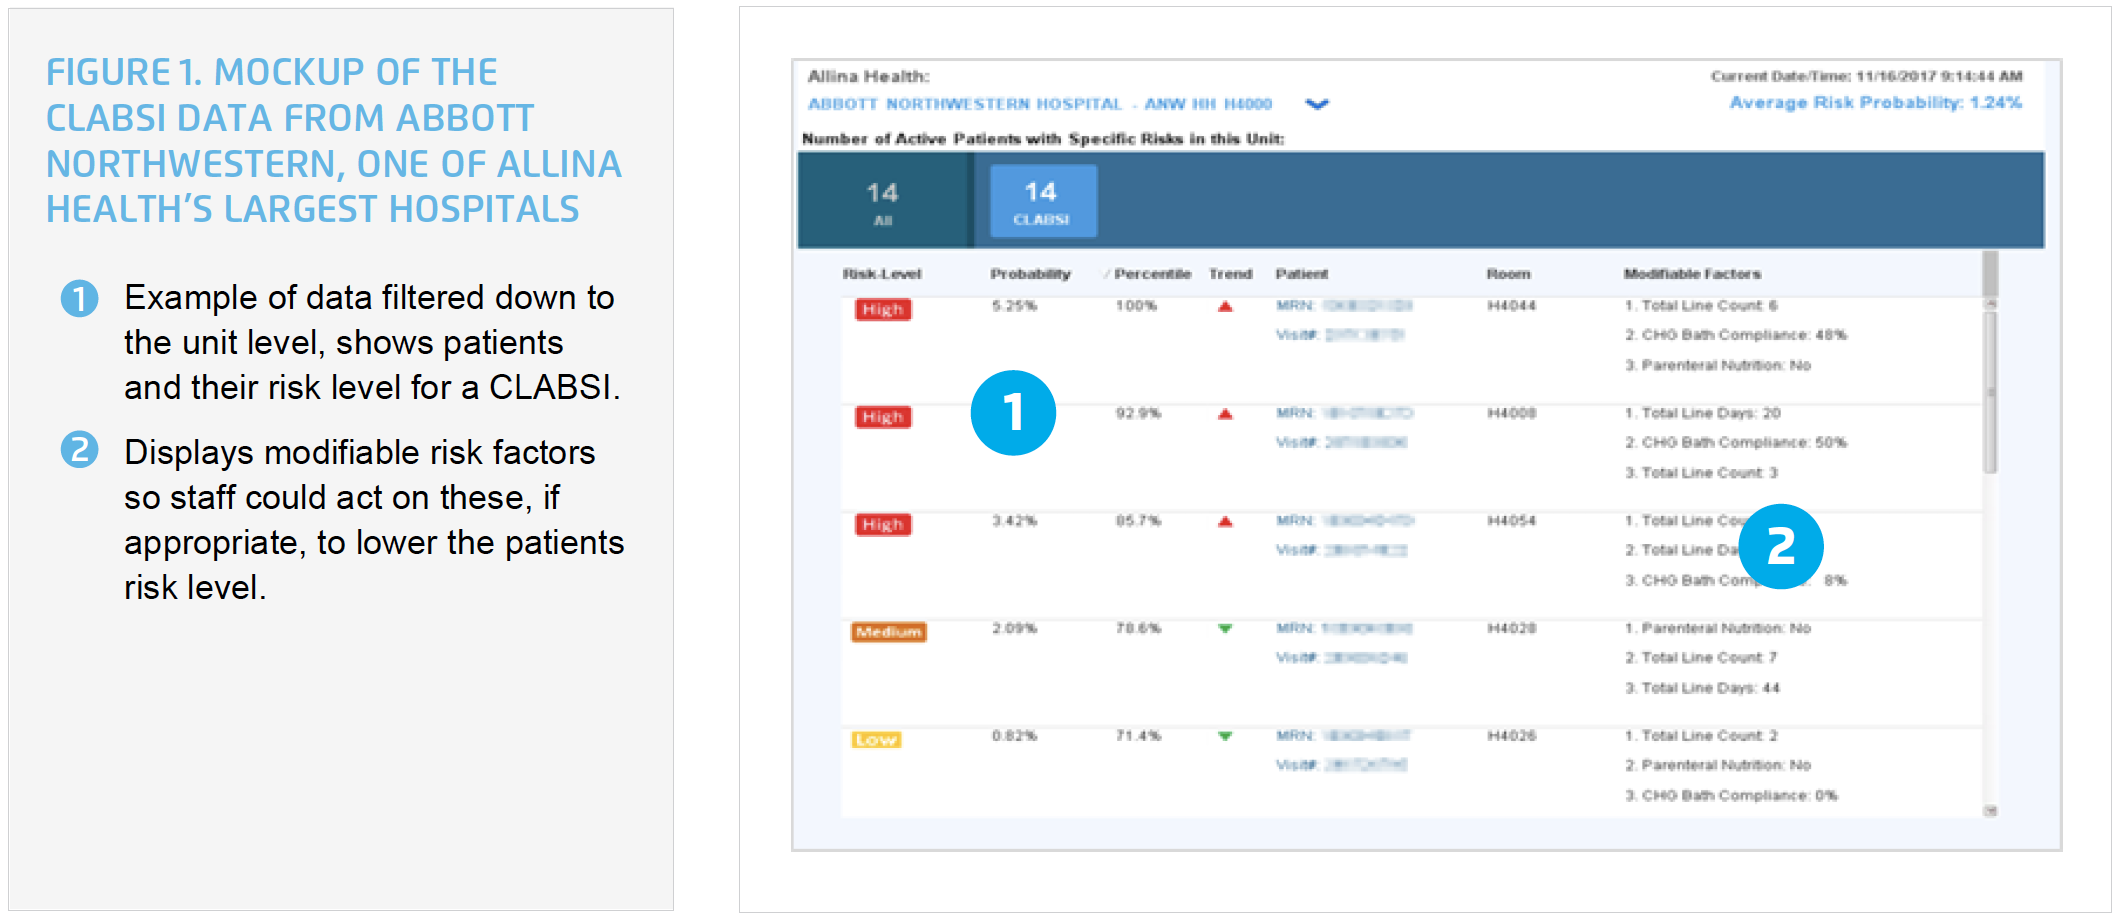
Allina Health’s long-term goal is to automate CLABSI surveillance and incorporate the information from the CLABSI risk predictive model into the workflow of clinicians to help identify patients at risk in real time, prompting swift interventions to prevent CLABSI. This will be done using the Health Catalyst Patient Safety Monitor™: Surveillance Module and Allina Health’s EMR (see Figure 1).
Although this integrated approach to improving patient safety has not yet been operationalized across all of Allina Health, a pilot is underway. In the meantime, additional safety areas, triggers, and predictive models are being investigated and developed.