Operating Room Excellence: How One Hospital System is Driving Improvements with the Use of Advanced Analytics

- Improved ability to drive care and operational improvements with integrated data and analytics
- 20 percentage-point increase in first-case on-time surgical starts
- 85 percent reduction in staff hours required for data preparation and reporting
- Drove cultural transformation through engagement at all levels within the organization
Whether providing school-based healthcare to help students be healthier and better learners, or extending primary care hours at area practices to relieve hospital emergency department waiting times, Mission Health in North Carolina has always been dedicated to expanding access to care. To preserve this commitment in an era of declining reimbursement rates, Mission embarked on a strategic journey it calls “Mission re:DESIGN.” The health system’s goal was (and remains) nothing less than a radical redesign of clinical programs and processes so that patients receive the best possible care and experience with zero waste and harm.
To achieve such excellence, Mission needed better access to data to enable quick and informed decision-making. And for that, the health system would need an integrated, single source of truth to supply timely and reliable data.
THE OPERATING ROOM: A CLEAR OPPORTUNITY FOR QUALITY IMPROVEMENT
Mission Health’s 47 operating rooms are the health system’s biggest revenue generators, accounting for a substantial share of revenue and cost. Thus, knowing that improved access to data-driven insight into baseline measurement and opportunities for clinical and operational improvements could affect real change for the organization, Mission identified surgery as an early priority to leverage analytics.
As with most hospitals1, the efficient use of Mission’s operating rooms (ORs) was paramount to the entire organization’s financial sustainability. In a review of potential efficiency improvement opportunities, Mission identified scheduling and delegating resources as the critical first areas of focus.
Although Mission had automated numerous processes over the years, a daily surgical workflow dashboard was not yet one of them. Instead, the health system relied on a manual data-preparation process from multiple disparate systems—which was inefficient from a timing perspective and carried the risk of potential data quality issues. Pulling data from different systems—about five in total, including the EHR and raw budget file—and generating operational reports for Mission’s system of ORs consumed nearly half a full-time employee (FTE).
Despite all of this dedicated time and effort, many data gaps existed. It was difficult, if not impossible, to make quality, financial, and operational improvement decisions—especially with limited ability to quickly make changes to queries, such as drilling down into the data. For example, Mission was unable to focus in on specific time periods to see which cases were driving delays and other issues with scheduled surgeries.
New tools for decision-making in the OR
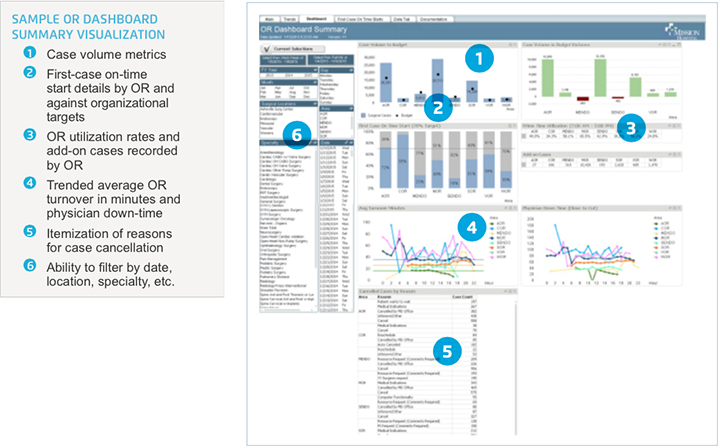
An emerging best practice among leading hospitals is making use of an operating room dashboard, a data-rich tool that helps clinicians and administrators make the right call on allocating valuable resources.
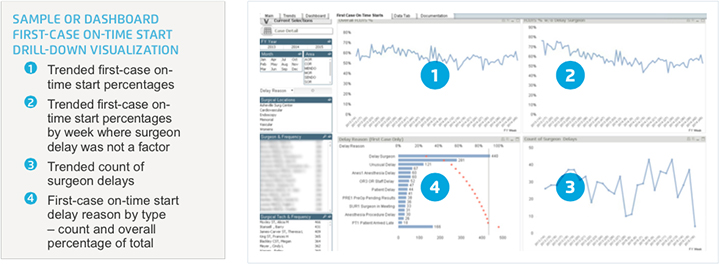
It also helps identify areas for efficiency improvements—and, not surprisingly, one of the most profitable areas to start improving is with first-case on-time starts. As most who have worked in the OR know, when the first surgical case of the day is delayed, the rest of the day is typically impacted with a series of late starts, as well. Among the chief reasons for the first (and subsequent) delays is lack of timely and comprehensive data about each of the surgeries scheduled. An automated workflow dashboard could improve visibility to this information in and out of Mission’s operating rooms.
Of course, technology alone would not fully drive improvement to meet quality goals. In the typical hospital environment, many different employees and departments have a stake in the OR’s limited resources, and to embrace the use of an analytical OR dashboard, all must be committed to data-driven decision-making. For that to happen, Mission needed to drive a paradigm shift throughout the organization to embrace an evidence-based culture. The health system would need to educate and encourage people, at all levels, on the use and value of data automation and actionable information to make better care and operational decisions.
THE DATA-DRIVEN SOLUTION FOR OPERATING ROOM EFFICIENCY
To deploy analytics that would help make lasting improvements in the operating room, Mission implemented the Surgery Workflow Operations Dashboard and Late-Binding Enterprise Data Warehouse (EDW) platform by Health Catalyst. The EDW aggregates data from source systems throughout the organization to create a single source of truth that feeds the OR dashboard and other analytical applications being developed.
Mission’s Surgery Workflow Operations Dashboard was customized to meet the health system’s needs. Its top features include:
- Clear metrics that align with the organization’s goals and objectives
- Intuitively displayed information for quick exploration and insight
- Summary views, trends, and drill-down capabilities to filter into greater detail on individual metric

With new analytical capabilities, stakeholders across the hospital can more confidently make sounder decisions about one of the hospital’s biggest revenue generators and cost centers, the operating room.

To promote adoption of this technology and realize the value of self-service analytics, the health system assigned a small
work team to collaborate on customizing the application and educating end users. This designated work team contained representation from key stakeholders, including senior and mid- level administrative staff, and front-line employees directly engaged in driving quality improvements in the OR. As the team rolls out the OR dashboard to additional hospitals in their organization, their objectives will include:
- Provide users with a deep understanding and of the value of the data
- Present information from a clinician’s perspective to demonstrate how the data could be used to improve processes for better outcomes
- Show how self-service analytical tools replace tedious and inefficient manual processes with more meaningful information—and more meaningful work
RESULTS
At last, Mission had valuable analytics at hand to drive major quality improvements in critical areas. The results were significant:
Improved ability to drive care and operational improvements with integrated data and analytics
Quick implementation of the EDW—which aggregated data from six data sources in just nine months—provided a single source of truth to guide improvement efforts. The OR Dashboard running on the EDW platform delivers drill-down and data visualization capabilities that help the OR team identify important trends and potential gaps. This single source of truth not only resolves previous concerns about the completeness and quality of the data used for OR analytics, it also delivers data updates without requiring so many valuable resources to collect and report out. This timely process supports quick and flexible decision-making.
20 percentage-point increase in first-case on-time surgical starts
Increased access to complete and detailed information provided unprecedented visibility into the key drivers for first-case on-time surgical starts. Insight from the OR Dashboard enabled monitoring of two key areas to address in order to improve this important metric: doctor on-time arrival and readiness of OR equipment. Efforts to address these two areas have resulted in dramatic improvement—20 percent to date. The team reviews this data daily to assess impact of initiatives and identify opportunities for continuous improvement.
85 percent reduction in staff hours required for data preparation and reporting
The previous manual data preparation and reporting process required nearly half an FTE to maintain and accommodate -off report requests. And, in many cases, reporting requests could not be met at all based on the time required to meet the request or the inability to access the data needed.
Now, data automation, powered by the EDW and analytical applications, has reduced staff time significantly. Less than a tenth of an FTE from a data architect is needed to sustain the automated reporting process. Team members can now focus on analysis and enhancing the analytical platform, benefitting both the organization and the employees.
Drove cultural transformation through engagement at all levels within the organization
Staff quickly recognized the potential of the new analytical application, thanks to dedicated education and training from the implementation team. In addition to detailed training, internal socialization of OR dashboard successes to date has helped drive acceptance and adoption of the new, data-driven processes. Staff have, in fact, made the OR dashboard an essential component of their everyday work.
The fact that the solution presents information from a clinician’s perspective—showing how the data improves processes, which then translates to improved outcomes—has been key to engaging clinicians and establishing a data-driven culture. Self-service analytical tools made available to all levels, from leadership to clinicians on the frontlines of surgical care, also increase engagement. Such data transparency and ease of access empowers users to identify improvement opportunities and make decisions that enhance clinical and operational effectiveness.
“Because of the growing complexity and demands of the healthcare environment (e.g., clinical care, operations, regulatory environment, declining reimbursement, and the need to control costs), every healthcare organization needs access to good data. With the implementation of our EDW we now have a truly integrated, single source of truth to support the best practices, care process models, and population health management that healthcare will only require even more in the future.”
– Jill Hoggard Green, Ph.D., RN Chief Operating Officer
WHAT’S NEXT
“Mission anticipates a $5-7 million savings opportunity in their OR supply chain, with the OR dashboard delivering the insight needed to drive these savings,” says Jon Brown, Vice President & Associate Chief Information Officer. With an eye on removing similar waste and redundancy in other departments, the health system has established teams to leverage advanced analytics to improve care in key areas including C-section, heart failure, sepsis, and newborn. Permanent work teams are being put in place to drive engagement in data-driven improvement initiatives, a cultural shift that is proving beneficial to Mission. Additionally, work is underway to standardize data definitions and the framework for consumption.
As “Mission: reDESIGN” marches into the future with enhanced processes, quality improvements will also move forward, ably assisted by analytics and a data-driven culture.
References
- Park, Kyung W. M.D., M.B.A., Smalzt, Detley, Ph.D., McFadden, David, M.D., Souba, Wiley, M.D., Sc.D., Ph.D. (2010). The Operating Room Dashboard {Abstract}. Journal of Surgical Research. 164(2), 294-300.
ABOUT HEALTH CATALYST
Health Catalyst is a mission-driven data warehousing and analytics company that helps healthcare organizations of all sizes perform the clinical, financial, and operational reporting and analysis needed for population health and accountable care. Our proven enterprise data warehouse (EDW) and analytics platform helps improve quality, add efficiency and lower costs in support of more than 50 million patients for organizations ranging from the largest US health system to forward-thinking physician practices. For more information, visit healthcatalyst.com, and follow us on Twitter, LinkedIn, and Facebook.
This website stores data such as cookies to enable essential site functionality, as well as marketing, personalization, and analytics. By remaining on this website you indicate your consent. For more information please visit our Privacy Policy.