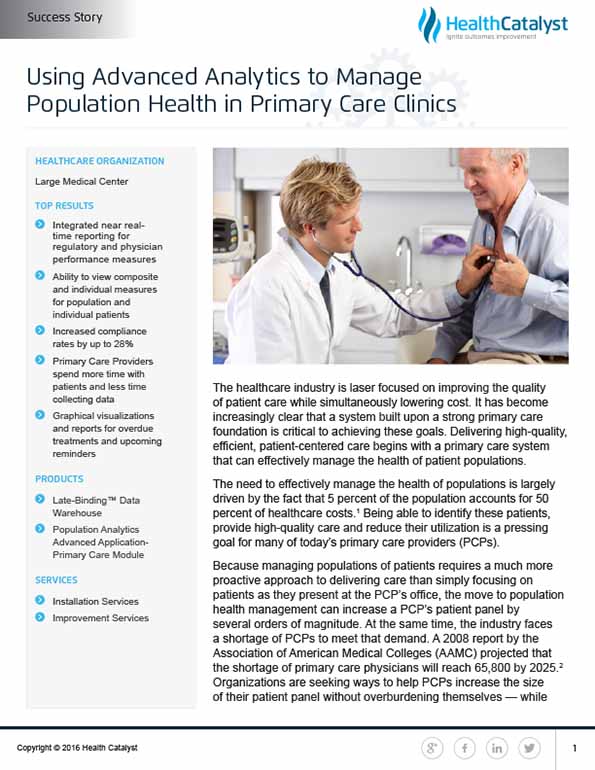
The healthcare industry is laser focused on improving the quality of patient care while simultaneously lowering cost. It has become increasingly clear that a system built upon a strong primary care foundation is critical to achieving these goals. Delivering high-quality, efficient, patient-centered care begins with a primary care system that can effectively manage the health of patient populations.
The need to effectively manage the health of populations is largely driven by the fact that 5 percent of the population accounts for 50 percent of healthcare costs.1 Being able to identify these patients, provide high-quality care and reduce their utilization is a pressing goal for many of today’s primary care providers (PCPs).
Because managing populations of patients requires a much more proactive approach to delivering care than simply focusing on patients as they present at the PCP’s office, the move to population health management can increase a PCP’s patient panel by several orders of magnitude. At the same time, the industry faces a shortage of PCPs to meet that demand. A 2008 report by the Association of American Medical Colleges (AAMC) projected that the shortage of primary care physicians will reach 65,800 by 2025.2 Organizations are seeking ways to help PCPs increase the size of their patient panel without overburdening themselves — while improving the quality of care. They have focused on two factors to make this possible:
Faced with these challenges, a large medical center is reengineering its primary care processes to help its ambulatory physicians effectively manage their patient populations while getting real value out of their EHR data. This health system is relying on data-driven, cost-effective, patient-centered, team and system-based care delivery to measure and improve health outcomes — and ultimately improve the lives of its patients.
To realize the potential of their EHR and make it possible for their outpatient clinics to manage patient populations, the health system worked with Health Catalyst to implement an analytical, clinical and process-based framework for value-based transformation.
The framework first introduced a healthcare enterprise data warehouse (EDW) to improve measurement and analytics throughout the organization. Health Catalyst’s EDW platform organized the system’s data into a single source of truth that serves as a foundation for data-driven improvement. The health system is leveraging the EDW to drive quality improvement initiatives throughout the organization — and this technology provided the necessary foundation for the effort to drive better primary care processes.
The system implemented their primary care improvement effort with 12 primary care clinics and 90 physicians that have approximately 55,000 patient visits per year. The project leaders understood that technology alone wouldn’t enable them to improve the overall value of care. So they implemented two additional aspects of Health Catalyst’s framework:
The workgroup consists of a permanent, multidisciplinary team of clinicians, technologists, analysts and quality personnel who collaborate to turn new insights gleaned from EDW data into better clinical processes. Lean process improvement experts are also included on the team to analyze and streamline the clinical workflow. The project leaders knew that reengineering how their primary care teams worked would be an essential part of improving the quality of care.
The Lean experts developed value stream maps to evaluate workflow. Looking at the process from end to end, they collaborated with other team members to:
These steps helped ensure that each member of the care team would play his or her most effective role in patient care and that the care team would be able to work with technology to drive better care processes and decisions.
The clinic has successfully applied lean process improvement to engage the entire care team to optimize delivery of care. Previously, physicians spent approximately a third of their time using the EHR to perform documentation and collect data for patient visits. Now these tasks are performed by other team members. A medical assistant (MA), not the physician, now sits with the patient to determine what interventions are required to proactively manage the patient’s health. The complete set of data is then available to the physician when she addresses the main reason for the patient’s visit.
Because data collection is now performed in a lean process improvement methodology where all members of the care team work together in concert, the physician is free to see patients in a timely fashion and address patients’ immediate concerns. Based on patient volumes in this clinic, the team estimates that physicians will be able to spend an additional 45 hours per month with patients rather than collecting data.
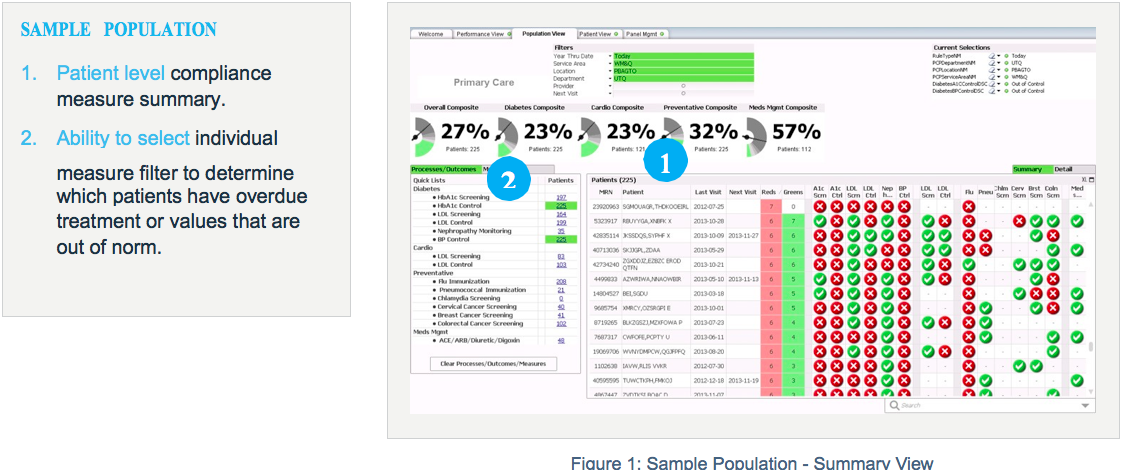
The clinic’s care team is using the Primary Care analytics application to better manage its population of patients. In the past, managing the population meant looking at dozens of separate reports (which couldn’t be run by the clinicians themselves) and trying to cobble together a complete picture of a patient’s health. Now, the Primary Care Module gives the care team a single, integrated view of every measure they are tracking. The application currently displays and tracks measures for:
The application lets them easily visualize — for both the individual patient and the population as a whole — compliance to these measures. They can see gaps in care, what interventions have been made, what treatments are overdue or upcoming, and more.
More measures will be added as the project progresses.
Over the past eighteen months — as new clinics were added — the patient population increased by 37 percent. Trended data is showing a steady increase in compliance on these measures:
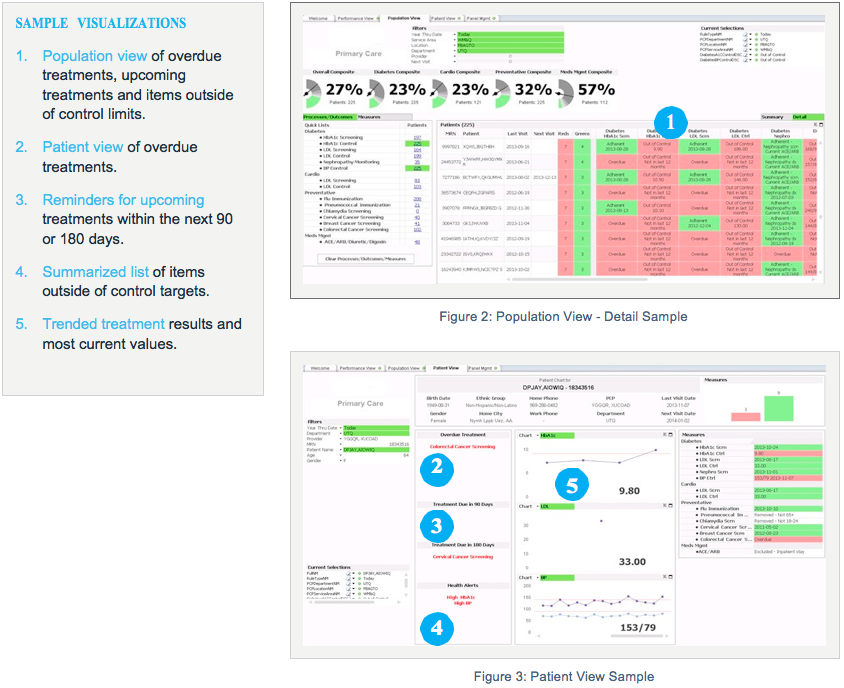
The care team reviews the primary care analytics dashboards, including compliance at the individual patient level. If a treatment is required in the next 90 days — and the patient has a scheduled primary care appointment — the care team will talk with the patient during their clinic visit about upcoming treatments. If the patient has a care gap, and a treatment has not been scheduled, the care team will help the patient set up his appointments. This process also enables the care team to identify and provide the appropriate documentation in the patient’s health record if the patient received treatment out of network (e.g. a flu vaccination at a pharmacy). The information is also available for the physician when she sees the patient.
If a treatment is needed and a visit hasn’t been scheduled — or the results suggest additional action is needed — the care team reaches out to the patient to schedule a telehealth or a clinic visit.
A significant benefit the analytics application has given the care team is a list of all patients who need upcoming treatments and those past due for treatment that require outreach communication. Having this information automatically available in easy-to-use visualizations empowers the entire care team to effectively manage the health of their populations.
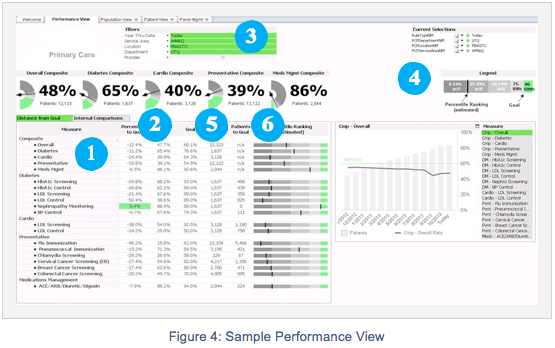
The care team is also using the Primary Care Module to track regulatory and physician performance measures. In the past these measures were tracked and reported separately. Today, many of these measures are now integrated into a single application. The team is also able to generate reports automatically. Previously, they had to coordinate with IT to have reports written — a lengthy process that introduced a significant time lag into the process and prevented the team from making timely adjustments to their processes. With the necessary data available in near real time in front of them, the care team can take action to schedule necessary treatments and better meet their compliance goals. The new process also saves time for IT staff, who can now focus on analysis rather than the details of generating reports.
The care team is using the application to track 15 measures for diabetes, cardiovascular, preventive care and medication management, as well as five composite measures. The number of measures tracked can expand indefinitely as the project progresses. The current project includes Meaningful Use and PQRS measures. The Primary Care Module also includes benchmarks for the care team to measure their performance. It integrates externally available state performance measure averages where available. Where these numbers are not available, the application displays internally established benchmark goals.
By automating external reporting, the health system has achieved level 4 of the Healthcare Analytics Adoption Model developed by thought leaders in the industry to guide organizations through their adoption of analytics technology. Their continuing efforts to use analytics to manage population health can steadily move them through the stages of the model.
“My big complaint about the shift to the EHR was that the technology negatively affected my interaction with the patient. A patient visit became a list of items I had to check off. With this new process, the doctor-patient relationship is back. It’s beyond refreshing to go back to patient-centered visits rather than IT- or checklist-centered visits.”
– Primary Care Physician
The health system plans to roll out this program to their other fifteen-plus primary care clinics. The EDW and Primary Care application are designed to easily scale for these additions.
Perhaps the most significant plan for this program is to use it to prepare the health system’s outpatient clinics for its potential future as an accountable care organization (ACO). Like many organizations, this health system is investigating an ACO environment in the future. The ability to track compliance over a number of primary care measures, meet quality benchmarks, focus on prevention, manage patients with chronic diseases, as well as integrate patient satisfaction, financial and other data in a streamlined data capture process delivers a solid foundation for ACO success.