Practice managers play a vital behind-the-scenes role in outpatient care. They are responsible for appointment scheduling, clinic and office operations, patient communication, personnel management, coding and billing, medical record management and practice financial management.
These functions have become more important than ever as the healthcare industry transitions to a value-based care model. Efficient practice managers balance appointment demand, improve clinic efficiency and optimize time management for physicians—with a measurable effect on both patient and physician satisfaction. Ineffective practice management can lead to poor patient satisfaction, overloaded staff and billing errors. Such problems reduce revenue, raise costs, frustrate physicians and may cause patients to seek care elsewhere.
As part of its system-wide goal to achieve in excess of $60 million in operational improvements, Texas Children’s Hospital—a not-for-profit organization consistently ranked among the top children’s hospitals in the nation—decided to tackle its practice management processes. Specifically, the health system sought to achieve improved practice efficiencies enabling greater access to care for patients and families that they projected would also result in a $20 million improvement. That improvement comes from optimal practice management and enhanced provider productivity.
Texas Children’s efforts to improve operational efficiency and productivity were hindered by inadequate access to timely data and a lack of effective tools to manage key processes.
Practice managers had to use a time- and resource-intensive process to repeatedly pull, validate and integrate data from five disparate databases in order to calculate key metrics and generate the reports and data visualizations required by leadership to effectively manage physician services. They used this complex process on a regular basis to track basic appointment metrics— the number of scheduled appointments, completed appointments, cancellations, no-shows and “left without being seen.” They also needed to track other key operational metrics such as:
In addition to their problems tracking metrics, practice managers lacked a schedule template utilization tool to help clinics determine if a provider’s schedule was well utilized and to help them reach the 90 percent target. Furthermore, open encounters—encounters not yet dictated, signed and coded—were difficult to manage and close within the desired timeframe, creating issues related to patient service, patient safety, timely billing and revenue optimization. Finally, meaningful use (MU) data2 specific to patient portal usage was not easily accessible to practice managers, making it difficult to know if patients were adequately accessing their personal health information via the health system’s patient portal or if the MU criterion for portal usage was being met.
Without consolidating clinical, financial, operational and other data into a single source of truth and making it more accessible, practice managers and health system leadership did not routinely have a clear line of sight into physician services performance. Such visibility would be required to maximize performance, efficiency, productivity and revenues.
To address its data and analytics needs, Texas Children’s implemented a late-binding enterprise data warehouse (EDW) and an advanced analytics application from Health Catalyst. The EDW aggregates data from all necessary sources and makes it securely accessible through the analytics application.
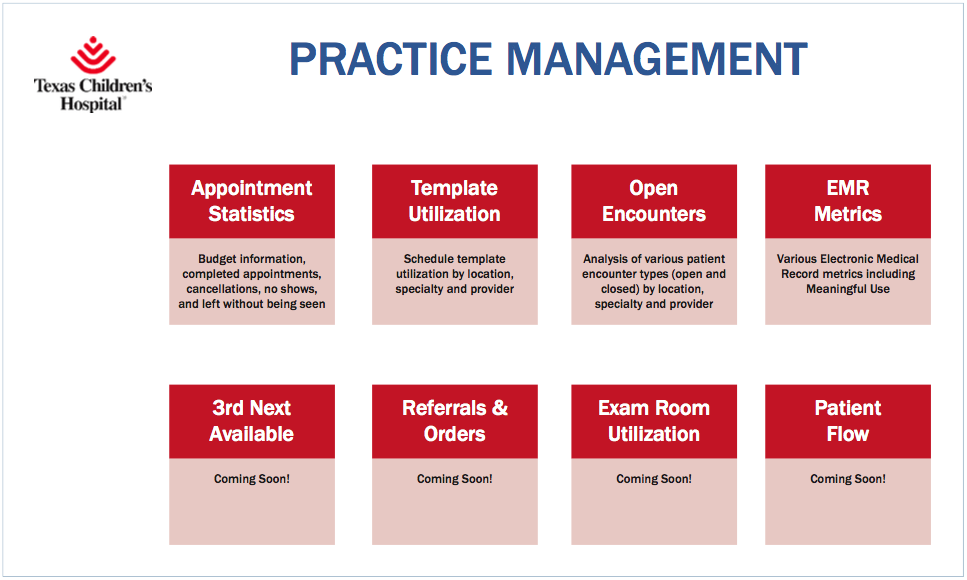
With the near real-time data provided by the EDW, clinic managers and leadership can intervene more quickly to optimize productivity and utilization and to improve patients’ access to care. Currently, the analytics application delivers a dashboard of integrated data views, including appointment statistics, scheduling utilization templates and open encounters. The dashboard is expanding to include MU metrics, third next available appointment, referrals, orders, exam room utilization and patient flow (Figure 1).
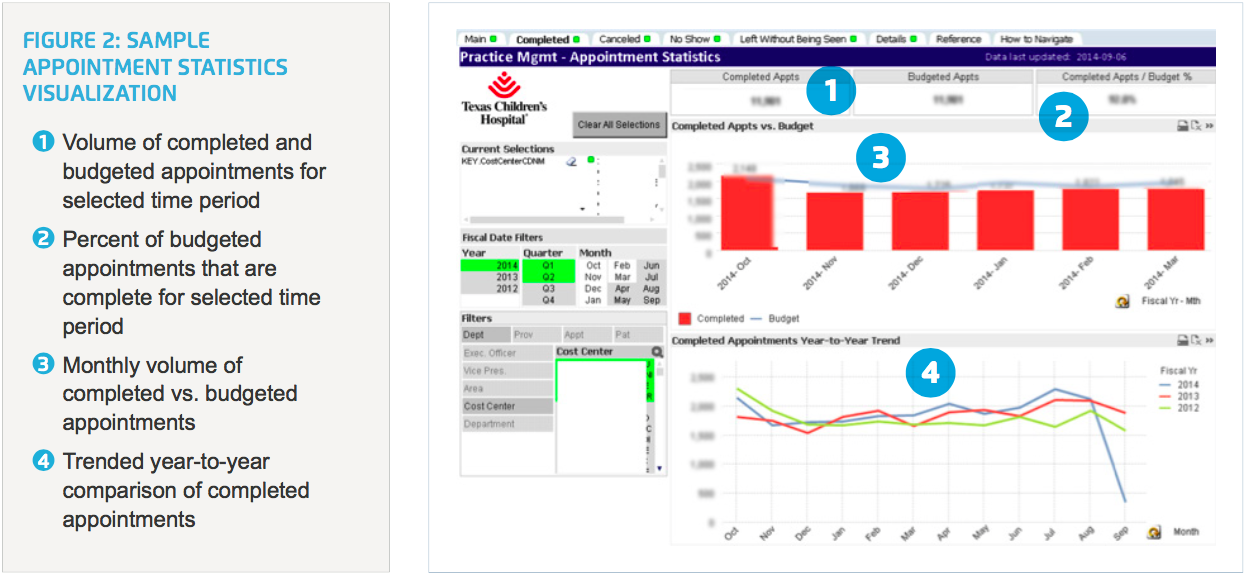
Practice managers now have ready access to an appointment statistics dashboard (Figure 2) that displays key indicators of practice performance, including performance to budget, monthly volume trends and data regarding completed appointments, cancelled appointments, no shows and “left without being seen.” This view of how the practice is performing—updated daily—enables managers to identify any shortcomings versus budget expectations and, importantly, to drill down into the data to determine root cause so that the practice can address issues proactively. Providers, too, access the dashboard to evaluate whether they are performing in line with expectations.
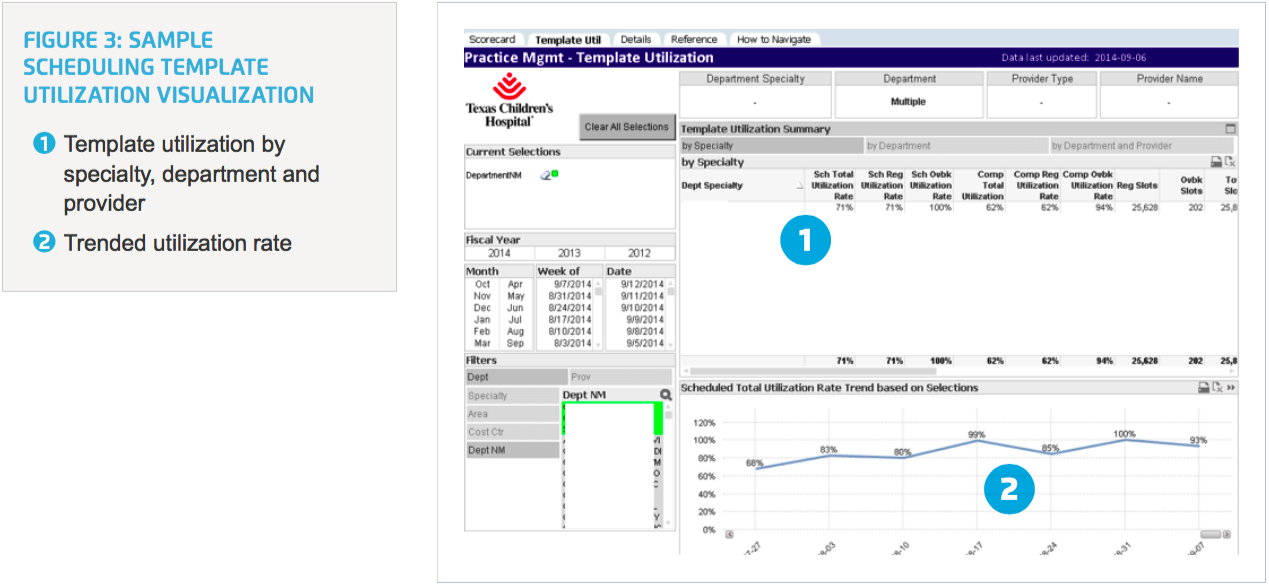
Texas Children’s practice managers now enjoy timely, routine access to schedule template utilization information. Leaders are able to drill down to the provider level at a given location of care (Figure 3). They can visualize scheduled and completed template utilization by specialty, department or provider trended over time—making it easy to identify issues quickly and determine a resolution for more efficient provider time management.
For example, a practice manager discovered that a nurse practitioner’s (NP’s) template at one health center was not filling up as expected. The reason, they discovered, was that most patients at this health center preferred to see a physician instead of a NP. They relocated this underutilized provider to another health center with a new and growing outpatient service where she was quickly able to accommodate high demand for patient care at that location.
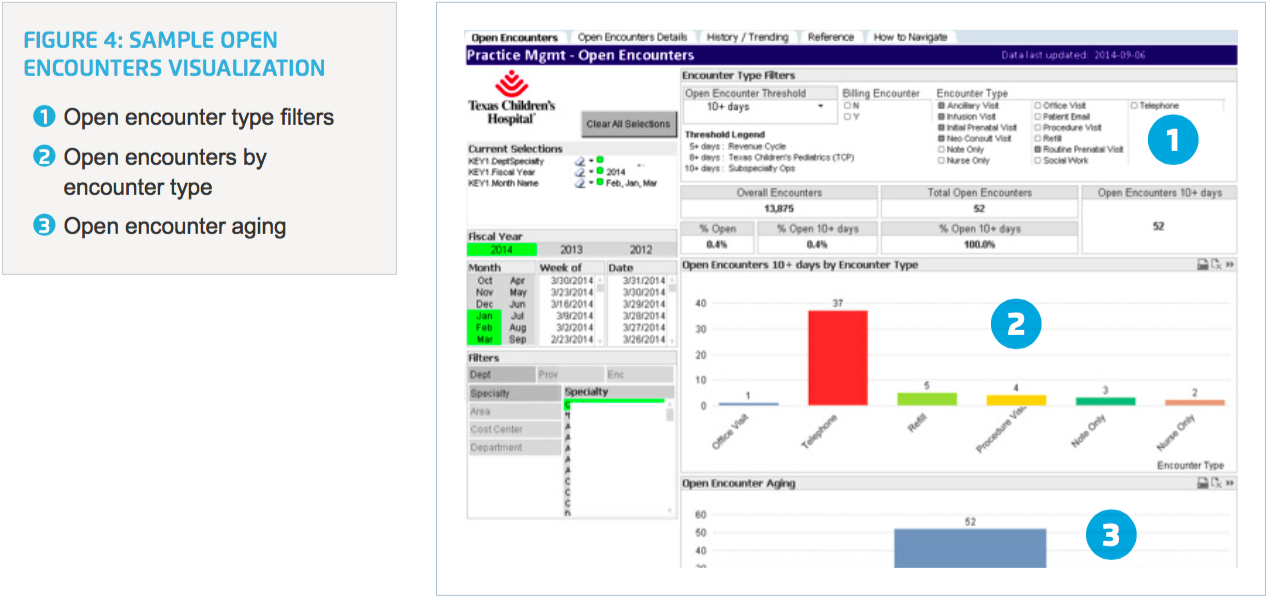
In the past, practice managers never received open encounter reports on a timely basis. They now have easy access to near real- time open encounter data (Figure 4) and can view open encounters across the various health centers. Metrics include office visits, infusion visits, procedure visits, telephone encounters, refill requests, patient emails and others. This unprecedented visibility is helping them achieve their goal of closing out all patient encounters in a much more timely fashion so they can meet revenue expectations.
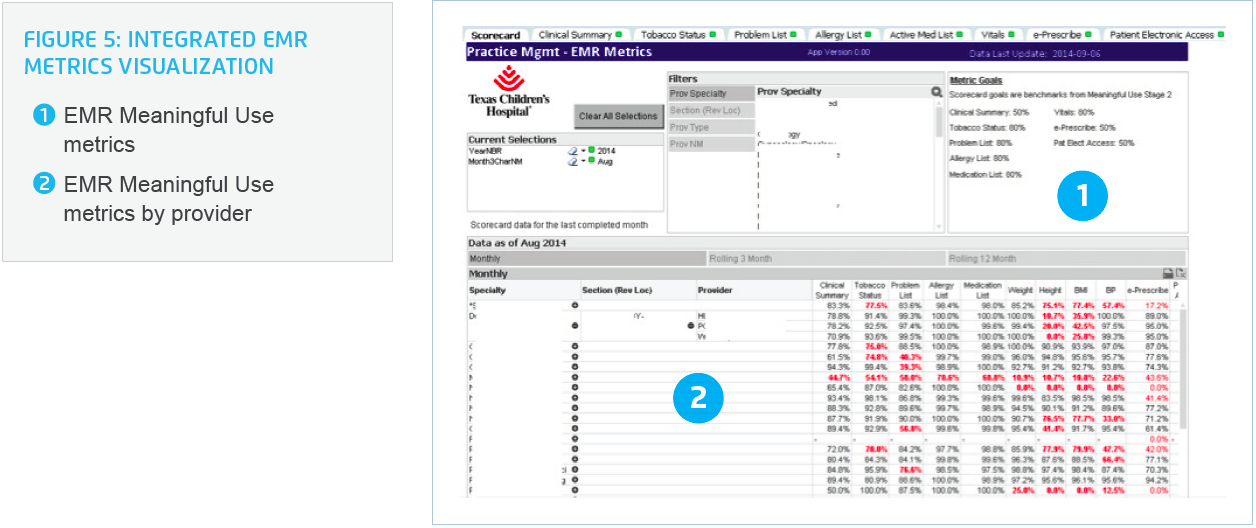
Finally, practice managers use the advanced analytics application to track MU metrics from the health system’s electronic health record (EHR), which enables them to visualize each provider’s progress towards improved preventative care and ultimately improved clinical outcomes (Figure 5). This tracking ability increases ownership among practice staff with respect to various MU metrics such as tobacco status, height/weight/BMI/BP, problem lists, allergy lists and medication lists. They are also better able to promote patient use of Texas Children’s online patient portal, which allows patients to participate more effectively in managing their health.
As a result of its overall data-driven Delivering on the Vision (DOTV) initiative, Texas Children’s has exceeded its initial goal and has improved operating margins by $74 million to date by improving quality, increasing system-wide efficiency, eliminating workflow waste and lowering costs. The health system attributes an estimated $20 million of this savings to improved performance in physician services. Performance improvements include:
Furthermore, practice managers are able to spend more time optimizing clinic operations and closing revenue generating encounters rather than cobbling together data, visualizations and reports. Previously, they spent approximately six days each month gathering data from more than ten disparate databases, manually calculating metrics and preparing visualizations and reports. Now they access information quickly and conveniently in the analytics application. The application also streamlines their preparation for quarterly performance reviews with hospital senior leaders. Whereas this preparation took each practice manager six business days in the past, it now takes only one hour for each manager to use the applications to gather the necessary information.
Finally, Texas Children’s leaders now have a single source of truth for assessing performance. This source provides access to all metrics, as well as drill-down capabilities for deeper analysis of problems or concerns. With the near real-time data delivered by the EDW, leaders can make decisions unhampered by data lags or reporting delays.
“Effective practice management leads to enhanced provider productivity. It’s easy to claim that a provider has poor time management skills. But we find that, most often, issues of practice management are really to blame. We look at operational metrics such as: Are we staffing our providers effectively? Utilizing our exam rooms efficiently? If the practice’s operational metrics are clicking well, the physician usually clicks along well too.”
– Mark Mullarkey, Senior Vice President
Texas Children’s has identified many opportunities for further improvement in operations beyond practice management where they can further leverage the EDW. They plan to implement additional analytics applications from Health Catalyst designed to help practices manage referrals and orders, exam room utilization and patient flow.
1. Third Next Available Appointment (n.d.). from Institute for Healthcare Improvement website.
2. Step 5: Achieve Meaningful Use Stage 1 (n.d.). from HealthIT.gov.