Improving productivity in our healthcare system—and thus decreasing costs and increasing access to care—is one of the most important tasks facing health systems today.1,2 Delivering the highest quality care to a broader population of children is the top priority of Texas Children’s Hospital, a not-for-profit organization consistently ranked among the top children’s hospitals in the nation. Between its hospitals, affiliated practices and health plan, Texas Children’s manages more than one million patient encounters each year.
In a difficult economic climate, Texas Children’s leaders recognized that the organization would have to significantly reduce costs at the same time as it enhanced quality and patient access. To achieve this goal, they launched a system-wide initiative to generate $74 million in operational improvements. As part of this initiative, they were determined to achieve a $20 million improvement in physician services through optimal practice management and enhanced physician productivity. By improving provider productivity, the health system could provide more services to more children while also maintaining a solid bottom line.
Improving provider productivity requires extensive analysis to identify potential areas of improvement. To analyze and assess productivity, Texas Children’s relies on a unit of measure called work Relative Value Units (wRVUs), using the RVU reimbursement table developed by the Centers for Medicaid and Medicare (CMS).3 wRVUs are numbers assigned to services that establish the differing amounts of provider effort and expertise associated with a clinical care event.
Determining productivity objectives based on wRVUs and then tracking performance against those objectives requires the health system to account for several variables. Health system leaders use national benchmarks to set individual provider wRVU targets and ensure competitive compensation. They must also track how many clinical FTEs they have when determining productivity objectives. In addition, they assess the amount of time each provider allocates to four categories of work—clinical care, academics, research and teaching. A physician who has a substantial teaching or research component to their position will have a lower wRVU target.
Texas Children’s budgeting process includes a monthly forecast of wRVUs that accounts for the estimated number of patients that practice managers expect to see to inform the wRVU forecast calculation. Health system leaders monitor progress against the forecast on a continuous basis and intervene when necessary to ensure the wRVUs are on track to achieve the target.
Needless to say, analyzing provider productivity requires sophisticated analysis. However, Texas Children’s existing analytical process was far too labor intensive to support good and efficient decision-making. In the effort to assess provider productivity, practice managers were required to access multiple databases on an ongoing basis to gather the data required to calculate wRVUs. Data that needed to be routinely gathered, integrated and analyzed to assess the productivity of each provider included:
The effort was resource intensive and time consuming. In fact, it took four weeks to obtain the necessary wRVU data. To compound matters, the resulting reports lacked a common look or feel. Each report was unique to the practice administrator, revenue cycle manager or data analyst that produced it.
This complicated, time-consuming and inconsistent process made it very difficult—and sometimes impossible—for leadership to understand where physicians’ productivity and associated compensation stood compared to their peers internally and nationwide. Although Texas Children’s has a very strong culture of transparency, section chiefs and administrative leaders often did not have access to the data they needed to effectively lead and manage in their areas of responsibility.
To realize their operational efficiency, productivity and revenue goals, Texas Children’s implemented a late binding enterprise data warehouse (EDW) platform and healthcare analytics applications from Health Catalyst. The EDW integrates data from sources like the health system’s electronic health record (EHR), financial systems and operational systems, as well as from external sources such as the Baylor College of Medicine, to create an enterprise-wide, integrated, single source of truth to inform clinical and operational decisions.
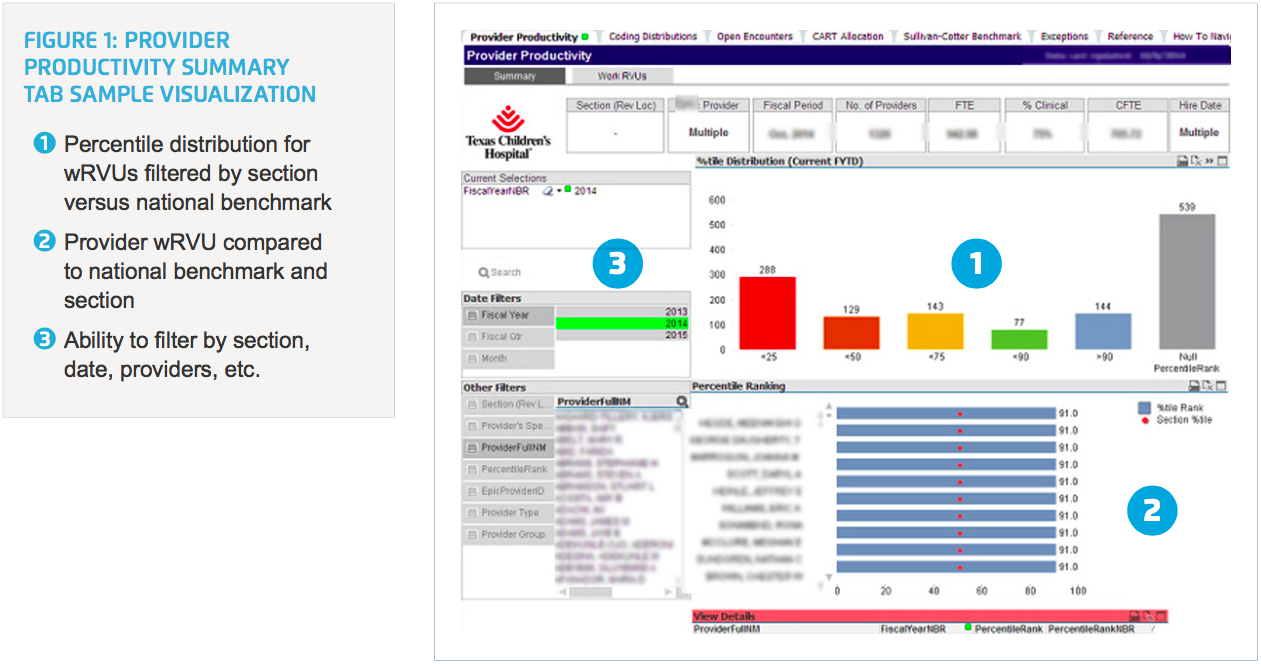
Texas Children’s also implemented a suite of analytics applications—designed specifically to measure provider productivity—that pull near real-time data from the EDW. Through the application, section chiefs and operational leaders have routine and easy access to near real-time data and visualizations that enable them to assess productivity and compare providers to one another internally and to national benchmarks. This insight helps ensure that compensation is commensurate with work effort within specialties. Application users can filter by section (e.g., cardiology) and down to the individual provider (Figure 1).
The application allows users to drill into a physician’s or group’s performance, pinpoint opportunities for improving productivity, or discover the reasons behind differences in productivity. For example, an analysis might reveal that a physician has only been employed at the health system for a year and is still ramping up, explaining lower productivity. Likewise, a more accurate assessment of how a physician is allocating her time between clinical care, academics, research and teaching could explain an apparent low level of productivity.
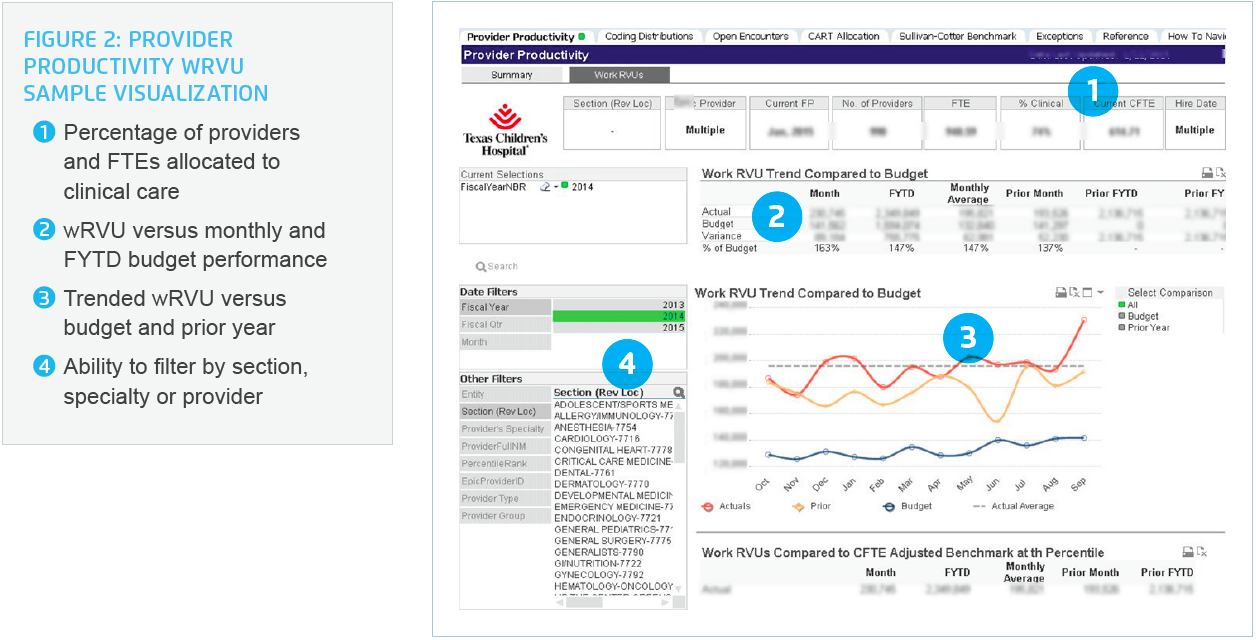
The solution also streamlines the budgeting process. Each year, health system leaders establish a wRVU forecast. In the past, they would track actuals against the budget on a monthly basis. Now, the EDW enables them to compare overall RVUs to the budget in near real-time (Figure 2). They can promptly identify any deviation from the forecast, drill down into the data to determine the root cause and then implement an effective solution. For example, one analysis determined that a specific clinic location exhibited a higher than average no-show rate, which was negatively impacting productivity. Scheduling changes were subsequently made to allow the providers to be more productive.
With the integration of external benchmarking data in the EDW, Texas Children’s can more easily establish targets to improve productivity. Leaders are now able to track and assess progress towards closing wRVU gaps between the health system’s performance and a benchmark, which in turn can drive improvement to the bottom line. In fact, Texas Children’s calculates that closing this gap translates to a $55 million net revenue opportunity.
Finally, the number of clinical FTEs is now more accurate, since leaders have better visibility into how providers are allocating their time between clinical care, academics, research and teaching. For example, in pediatrics an initial estimate of approximately 500 FTEs was revised downward to 300 FTEs due to the academic, teaching and research work efforts the actual clinical FTEs are involved in. This type of assessment is essential for calculating the actual level of clinical productivity.
As a result of its overall data-driven “Delivering on the Vision” (DOTV) initiative, Texas Children’s has improved operating margins by $74 million to date by improving quality, increasing system-wide efficiency, eliminating workflow waste and lowering costs. The health system attributes an estimated $20 million of this savings to improved performance in physician services.
These improvements include:
“Having the data readily available encourages people to collaborate on improvement. Everyone now comes into conversations about physician productivity with the same data. They may differ in how they perceive the situation, but they can use the data to come to an agreement on what the truth is.”
– Dr. Gary Clark, Chief of Neurology
Texas Children’s will continue to build a culture focused on data-driven improvement, accountability, engagement and responsible change. The hospital will maintain its initiative for optimizing practice management and provider productivity. At the same time, it will also turn its attention to operational improvement in other areas such as finance and revenue cycle management.