The federal government established the Pioneer Accountable Care Organization (ACO) Model as a fast track for innovative organizations to move from a shared-savings to a population-based model for Medicare reimbursement.1 In May 2015, the Department of Health and Human Services (HHS) shared evidence that this model is already fulfilling its promise.
According to HHS, the Pioneer ACO Model generated more than $384 million in savings to Medicare oover its first two years—an average of approximately $300 per participating beneficiary per year—while continuing to deliver high-quality patient care. Furthermore, compared to their peers in Medicare Advantage plans, Medicare beneficiaries in Pioneer ACOs use inpatient hospital services less, have more follow-up visits after hospital discharge, and report more timely care and better communication with their providers.2
Mass General Brigham (formerly Partners HealthCare) is one of the 19 Pioneer ACOs operating in this successful but rapidly evolving regulatory and reimbursement environment. A not-for-profit health care system committed to patient care, research, teaching, and service to the local and global community, Mass General Brigham includes Brigham and Women’s Hospital and Massachusetts General Hospital, other community and specialty hospitals, a managed care organization, a physician network, community health centers, home care, and other health related entities.
Mass General Brigham had long recognized that continuously improving quality and value was essential to maintaining excellence. Mass General Brigham’s leaders understood that solid strategic information on their business and quality drivers would be essential to this improvement. The strategic information they required needed to be able to differentiate trends within trends due to different market forces. For instance, a decline in volume of inpatient admissions from their own ACO may be good and a reflection of better medical management, while a decline in volume of referral patients from other healthcare providers may be a reflection of loss of market share due to increased competition, which would be viewed as a negative outcome. Specifically, they determined that understanding drivers of hospital volume and other strategic business trends, whether arising as a result of their medical management programs, changes in referral patterns, or changes in the market in general, were critical to their business success.
Mass General Brigham sought to establish a system that would enable its teams to monitor and respond more quickly to changes in volumes, margins, and market trends. Due to the critical nature of this information, the organization needed a rapid-design solution so it could deliver the product quickly.
To meet this goal, Mass General Brigham had to change the way it had historically approached data analysis. Instead of pulling all of the necessary data together and then focusing on the questions that needed to be answered, Mass General Brigham’s leaders chose to focus first on the strategic need and intended use of the information. By placing emphasis on strategic questions rather than the technology solution itself, they could better ensure that the solution they designed would meet their business needs.
The organization also needed a sophisticated solution that would enable its teams to look at data from multiple angles with different inclusions and exclusions depending on the business question being asked. For example, Mass General Brigham needed to be able to see the information for all patients in the organization’s care management program, specific patient cohorts, referred patients by referral group, payer groupings, service lines, and more. In order to provide these multiple layers of information and filtering capability, the solution would have to include information from a wide range of data sources. In fact, it would have to include all information that would apply to answering questions about drivers, volume, and market trend. Furthermore, this data needed to include the most current data available; Mass General Brigham needed to analyze changes in trends in near real time to inform strategically meaningful decisions.
Finally, Mass General Brigham’s leaders recognized that implementing a technology solution alone would not ultimately drive improvements to quality and cost. They would need to build user acceptance and adoption to move the culture toward one of data-driven decision making. As such, the solution they put in place would have to be intuitive and easy to use.
To address the issue at hand, Mass General Brigham needed to:
Mass General Brigham’s leaders understood that the key to rapid design and limiting re-work was to identify the important business questions first and then build the solution to address them. Therefore, they first developed cross-functional teams to identify the key business questions and drivers as well as the key metrics that would help answer those questions.
Focused on drivers of trends in volume and margins, the teams identified these key business questions:
Then, they evaluated use cases to further define the key business questions. For example, they analyzed potential internal and external drivers of declines in inpatient and outpatient volume. They determined that volume changes could be driven by anyone—or a combination—of the following five categories:
To evaluate a use case, the teams would run it through each of the four bullets to see what questions they would need to ask and answer in order to accurately determine the driver of the volume change. This process helped them recognize what information would be needed in the application to fully answer questions about changing volumes.
Using the key business questions defined by the cross-functional teams as a guide, Mass General Brigham designed an analytics application that could identify the underlying healthcare business drivers impacting hospital, outpatient, and physician billing volume and margin. The application—internally branded as Healthcare Directions—leveraged data from Mass General Brigham’s enterprise data warehouse (EDW) platform, which brings together data from multiple sources. Currently, they have integrated hospital billing, payer claims, and additional market data. They are planning to add in data from physician billing data, post-acute, hospital occupancy in the near future. The application was designed to monitor actual hospital and physician billing volume and margin trends in near real-time. Over time, it would allow the team to develop leading indicators (metrics) to help predict volume and changes in care requirements. Having this strategic insight and predictive capability would allow Mass General Brigham to foresee what services, care locations and specialties their patients would be needing so that they could make sure that their patients had access to the right care in the right place at the right time.
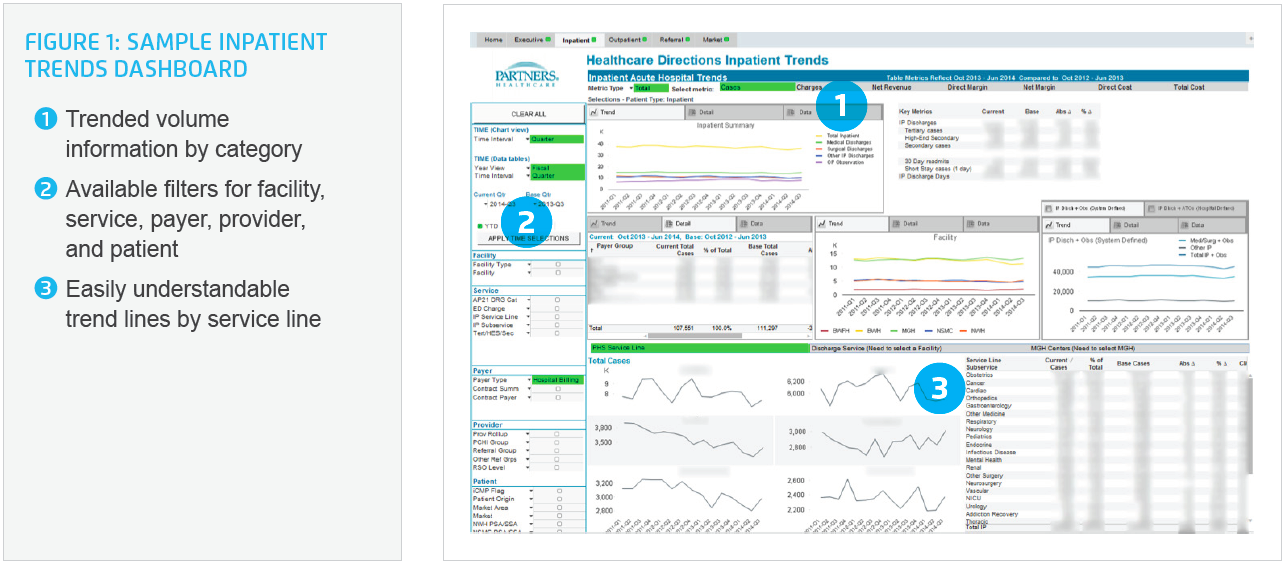
The team sought feedback from stakeholders to ensure that the analytics application presented information in a way that users could identify trends and further investigate the internal and external factors driving those trends through drill-down capability (Figure 1).
To deploy the application quickly and effectively, Mass General Brigham used iterative development and incremental implementation consistent with the Agile methodology. This rapid prototyping of models allowed for sequential releases on six to eight week cycles. Before investing the time to build each release, the team presented mockups to stakeholders for review to ensure that the product would meet their needs.
Recognizing that users are more likely to embrace data and information that is familiar, easy to access, and easy to understand, the Mass General Brigham team sought to consciously address those aspects in their application development and deployment. To make the data familiar, Mass General Brigham tried to accommodate local definitions of terms whenever they could, balanced by the need to standardize data definitions for consistency. The application delivers easily accessible and intuitive visualizations—such as graphs, tables, and trend lines—which are used to provide business intelligence to senior finance, clinical, and administrative leaders. Applying the application to known and needed use cases built acceptance and trust in the data and fostered willingness to use the information for other strategic purposes.
Furthermore, the team offered executive, informational, and educational outreach programs around each new release of the application. They relied on existing forums as vehicles to disseminate information as new capabilities were added to the application with each release.
Finally, members of the cross-functional workgroup that designed the application continued on as advisors to subsequent workgroups after deployment. Oversight by these subject-matter experts helped ensure that recommendations for revisions and improvements from the ongoing workgroups remained consistent with the application’s strategic purpose.
The deployment strategy outlined above enabled Mass General Brigham to experience a rapid time to value. By approaching the implementation incrementally, the team was able to release functionality in six to eight week cycles, which quickly brought the tool into the hands of those who needed it. Ideas for improvement were rapidly incorporated into the next release cycle, enabling the team to accomplish the following results:
In the past, data analysts spent approximately 50 percent of their time on manual data collection and reporting. They have now reduced this time to 10-20 percent. These time savings enable them to dedicate their expertise to analysis and predictive modelling. As a result, the organization has increased its capacity to respond to analytic requests for sophisticated analysis and decision support.
At the same time, Mass General Brigham hasn’t hired any net new staff or increased the budget in the finance and planning area for four years, and yet, within that timeframe, it has created two new departments and funded a process improvement team.
The Mass General Brigham team is able to answer strategic questions much more quickly. For example, service line reports that used to take 80 hours to produce can now be completed in eight hours. Furthermore, production of a report to evaluate underlying business assumptions for a new project when actual performance did not meet projections was reduced from 9 months to 3.5 weeks.
With easy access to data, Mass General Brigham is able to move more quickly from the analytic cycle to assessing strategic options. Analytics is helping the team hone in on key issues faster and more accurately. It also helps the team avoid choosing the wrong plateau points when putting together a business model.
Through the engagement strategy detailed above, Mass General Brigham was able to improve from a user base of 30 on its old analytics platform to 152 on the new platform. The team estimates a 25 percent adoption rate in the first year, and they expect to achieve full adoption within three years. Use of the data is expanding beyond the executive and operational audience. In a recent development, physicians have started to access the data, thus fostering more collaborative conversations. Mass General Brigham intends to continue building this momentum.
With the new application, Mass General Brigham has achieved a greater strategic orientation. The organization has added value to its previous capabilities by generating strategic context for observed trends and creating linkages across data elements to understand activity by patient cohorts, provider groups, and across institutions.
The traditional method of trending budget to actual—comparing this year to last year or this quarter to the same quarter last year—works in static environments. But in a dynamic healthcare environment, this traditional method is too slow at recognizing turns in the business trajectory.
Mass General Brigham’s new method of identifying and monitoring drivers of trends gives the organization more actionable information for making business decisions earlier. With the new system, the ACO is able to effectively evaluate budget variances and determine whether they result from poor budgeting or are due to underlying changes in the market.
“Our previous data warehouse approach was a sandbox. We brought a lot of data together in one place where it was easier to play with—but it was also harder to maneuver it to answer strategic questions. We needed a more sophisticated, proactive approach to be able to use our data effectively to answer strategic questions.”
- Lynne Eickholt, Chief Strategy Officer
Mass General Brigham will incorporate data from additional key source systems into the EDW. The team also plans to improve current forecasting models and expand their usage in budgeting and strategic planning. These and other efforts will lay the foundation for the organization to move fully into a predictive analytics environment that will ensure that they have the resources and services to meet patient care needs well into the future.