Health systems can directly impact the quality of emergency department (ED) care by reducing the time patients wait between arrival and seeing a qualified medical professional. Long ED wait times can reduce patient satisfaction and put patients at risk.
Mission Health determined that patients in its ED often waited more than 50 minutes to receive qualified medical care. To decrease this wait time, the hospital system sought to improve its ED patient flow. Using data-driven insights provided by use of its analytics platform, Mission could visualize each portion of the ED patient flow, enabling the improvement team to identify and respond to opportunities for process improvement.
In 2012, the ED visit rate in the U.S. was 42 visits per 100 people.1 Of 130.4 million visits to the ED, 9.3 percent result in a hospital admission. This contributes to more than half of all U.S. hospitals reporting over-crowding, one-third reporting an increase in ambulance diversion, and 90 percent reporting that they frequently operate “at” or “over” capacity.2
Mission Health’s Emergency Services include western North Carolina’s designated Level II Trauma Center at Mission Hospital, select telehealth specialties at regional hospitals with medical direction provided by Mission Hospital-based specialists, ground transportation by Regional Transport Services (RTS), and air transport provided by Mountain Area Medical Airlift (MAMA)—both transportation services can provide transport for neonatal patients.
Mission strives to provide world-class care to people and their families when they need it most with the aim to get every person to the desired outcome, first without harm, also without waste, and always with an exceptional experience for each person, family, and team member. The hospital system targeted improving ED care as part of its efforts to better its services overall.
Mission faced challenges in its ability to deliver effective emergency services. Large numbers of patients—upwards of 4,000 per year—were walking out of the ED without being seen by a provider. On average, patients waited more than 50 minutes to see a qualified medical provider after being triaged by the registered nurse.
Wait time is a significant quality issue because the number of minutes from patient arrival to being seen by a qualified medical provider negatively impacts patient satisfaction. Long waits can also put patients at risk.
Mission recognized the growth in ED patient volume hindered patient placement and throughput. Patients spent an excessive amount of time in the ED waiting for an inpatient bed or for the information they needed for an effective discharge which was impacting patient satisfaction and negatively impacting Mission’s ability to provide care to newly arriving patients.
To improve patient experience, the timeliness of care, and ED throughput, Mission redesigned its ED workflow to ensure it met patient needs efficiently. To be successful, they needed actionable data, along with engagement from not only the interdisciplinary team, but from the entire hospital system.
Mission improved its ED patient flow, patient experience, and ED throughput with a data-driven, systems approach. Because factors inside and outside the ED impacted care within the department, Mission focused its improvement strategy on the entire delivery system. These internal and external influencing factors included:
To ensure interdisciplinary participation, Mission established the ED joint practice team, which included physicians, advanced practice providers, ED nurses, quality improvement specialists, leaders from various departments within the hospital, representatives from radiology, pharmacy, registration, behavioral health, environmental services, EMS, laboratory, staff education, and security. All ED joint practice team members contributed their expertise and perspectives to process improvement activities in keeping with Mission’s goals.
As a result of the ED joint practice team’s active support and participation, and data-driven insights provided by the Health Catalyst® Analytics Platform, including the Late-Binding™ Data Warehouse and broad suite of analytics applications, Mission embarked on a systems-approach journey to redesign workflow within the ED.
Using the analytics application to analyze volume data for the previous four years, the Mission analytics team and ED leadership enhanced their understanding of visit volume and arrival time, evaluating arrivals every three minutes. This breadth of historical data gave Mission a deep understanding of patient volume and the impact of seasonality and holidays on both visit time and volume. The joint practice team used these identified trends to adjust staffing volumes to better align with peak days and hours throughout the year.
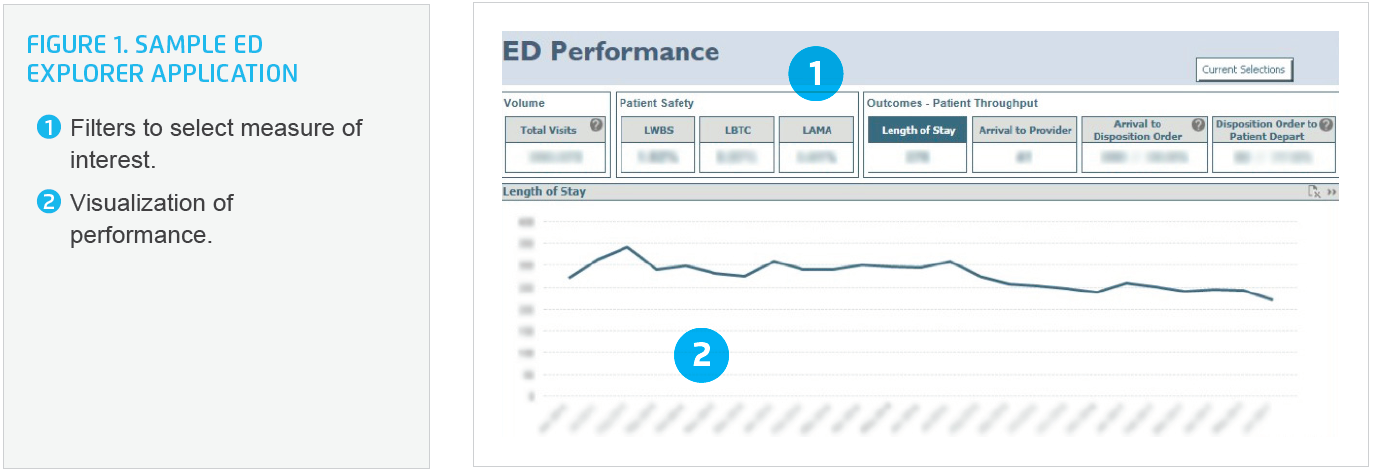
The Health Catalyst Analytics Platform provided a visualization of each portion of the ED patient flow and satisfaction with care (see Figure 1), including:
Data and analytics were a vital part of Mission’s ED improvement initiative. The data demonstrated that when Mission received 30 arrivals within an hour, 50 arrivals within two hours, or 65 arrivals within three hours, the ED became congested and throughput slowed. Based on this, Mission invested in workflow observation and redesign, making changes to improve high-impact workflows. The hospital system restructured the registration process, which improved patient privacy and efficiency. It redesigned the triage process, which ensured the alignment between the triage process and the most recent, evidence-based practice.
Mission also introduced a new role: an advanced practitioner, who would evaluate patients in conjunction with the triage nurse, allowing more timely initiation of care for patients who were not critically ill and would otherwise wait for care.
Improvements continued following triage: higher-acuity patients were placed in regular treatment rooms. Patients who were not critically ill were treated in a more space-efficient area.
Mission also developed a process and protocol for quickly responding to surges in ED volume. Rather than waiting to discover a halt in throughput after an increase in patient volume, the system developed a proactive response to increased patient arrivals (defined as more than 30 patients in an hour, 50 within two hours, or 65 within three hours). Using automated, secure text messaging, alerts notified key stakeholders to activate surge protocols.
When prompted, support departments—including environmental services, laboratory, and radiology—responded to the surge notification. Mission adjusted staffing and services to ensure continued throughput within the ED and the locations of care where some ED patients are admitted. Patient experience representatives also responded to the surge notification, increasing the time they spent in the ED waiting room helping mediate patient dissatisfaction. To ensure continued patient throughput throughout the hospital, the ED throughput coordinator worked with leaders and staff to redirect resources as needed.
The executive team and leaders responsible for ED throughput huddled early each morning to review the number of patients in the ED and developed plans of action to ensure patients were receiving timely care and effective ED throughput.
While implementing these standard ED processes, Mission maintained flexibility, empowering the team to adjust patient placement, staffing, and processes in response to unanticipated changes in patient types and volumes.
Mission also redesigned its discharge process. Previously, it had a single discharge location, to which patients awaiting discharge were moved. Research revealed patient dissatisfaction with the discharge process, and that the protocol inadvertently increased waste as patients were moved (and increased wait time for the patients). Mission brought the discharge activities back to the bedside, eliminating unnecessary patient movement.
In a little over one year, Mission’s data-driven, systems approach dramatically improved all aspects of ED throughput, including:
“Using a data-driven, systems approach helped us achieve our goals. You need data, and stakeholder commitment, to improve.”
– Rick Lee, MSN, RN, CEN, NE-BC, Executive Director, Emergency Services
Mission is focused on the continued use of a data-driven, systems approach to improvement, strengthening its ability to deliver world-class emergency care.