Monitoring and reporting of provider performance data often rely upon burdensome, problem-prone manual workflows, at times producing data that is misleading or inaccurate. With manual, time-consuming reporting methods, Dartmouth-Hitchcock Health (D-HH), based in Lebanon, NH, found it difficult to accurately measure and improve provider performance.
D-HH was committed to improving its provider performance reporting method to enable providers to easily access their performance data in order to deliver better care to patients. With the right analytics—using a provider metrics analytics accelerator—D-HH was able to implement an affordable solution while reducing the hours of manual reporting required by its financial analysts.
To improve quality and reduce costs, organizations must be able to monitor performance, including provider performance. Methods to monitor and report provider performance data often rely on burdensome, problem-prone manual workflows, at times producing data that is misleading or inaccurate.1
D-HH is New Hampshire’s only academic health system, serving a population of 1.9 million across New England, and providing access to more than 1,800 providers in almost every area of medicine.
The D-HH leadership team sought to report and monitor provider performance, using the data in partnership with section chiefs and chairs to continuously improve. Several pain points impeded efforts to monitor and report performance in a meaningful way.
Reporting provider performance depended on burdensome manual processes as relevant data originated from multiple sources. Each quarter, analysts would spend weeks developing service line reports manually, only to be out of date soon after they were published.
D-HH had a single, defined organizational standard for reporting, but standard data definitions were lacking. Different groups reported different measures in multiple locations. Reporting was not consistent, and leadership couldn’t view data at various levels, such as at the department and provider levels.
To effectively monitor and improve performance, D-HH needed to create one source of truth and eliminate the burdensome, manual processes it used for reporting.
After evaluating several third-party solutions, D-HH determined it didn’t need another third-party solution to improve the efficiency and effectiveness of monitoring provider metrics. Rather, the organization decided to leverage the Health Catalyst® Data Operating System (DOS™), partnering with Health Catalyst to implement a provider metrics analytics solution.
D-HH evaluated other applications, but none of the other applications provided an out-of-the-box solution that fit its needs. From its previous experience, D-HH was aware that the DOS data platform provided the flexibility it needed for reporting; the flexibility also supported the ongoing refinement and adjustment of metrics over time.
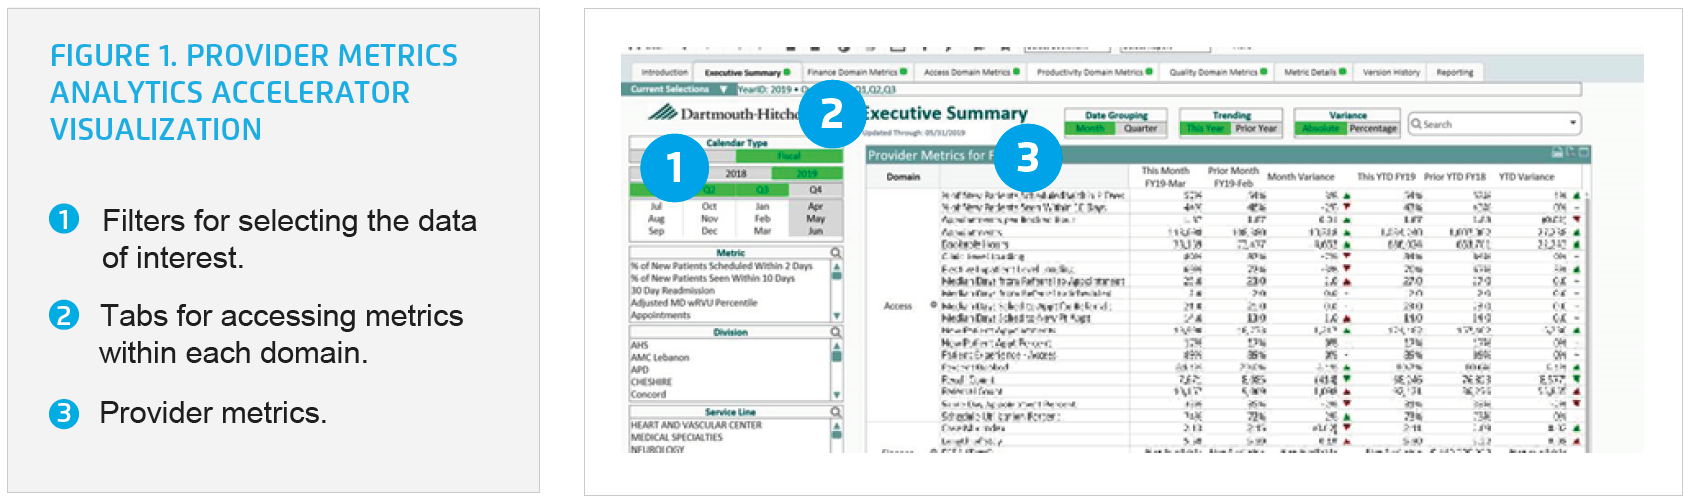
The Provider Metrics Analytics Accelerator provides D-HH easy access to provider metrics, including metrics in several domains (see Figure 1):
D-HH now has processes in place for data governance and has established standard data definitions, eliminating confusion about what each metric represents.
Using the analytics accelerator, D-HH can access detailed data at a department, section, or individual provider level. Leaders and providers can drill into the data, then slice and dice to obtain the information of interest. For example, if someone is interested in understanding a change in the percentage of new patients seen within 10 days, they can use the analytics accelerator to review current performance; they can drill into the detail, viewing information at the department, provider, and patient levels (see Figure 2).

The analytics accelerator supports the needs of a variety of users, including those who may not wish to explore the different views within the analytics accelerator. Data-savvy users can use the analytics accelerator to filter the data to the particular cohort and data of interest, then bookmark those selections, and share the bookmark with other users who are not comfortable using the analytics accelerator independently.
D-HH no longer has multiple departments distributing reports with different definitions for various metrics. For the first time, D-HH has a single source of truth for provider performance metrics. The organization centralized the definitions for each metric and the distribution of the metrics through the analytics accelerator. In addition, the structure developed in provider metrics has provided D-HH with a template that they have been able to easily replicate and tweak to create a number of other dashboarding applications.
The analytics accelerator has made the organization more agile and responsive to senior leadership inquiries. As the needs of the organization and leadership team change, D-HH can seamlessly add, edit, refine, and refresh data in real-time.
Additionally, the organization saved:
“We are now able to meet the organization’s changing priorities, and are better able to provide data about provider performance."
– Elizabeth Stedina, MBA, MS, VP of Data Analytics
D-HH plans to maximize the impact of the analytics accelerator, adding metrics as needed to meet the changing business needs of the organization.