Hospital readmissions carry significant financial costs and are associated with negative patient outcomes. While the reasons behind patient readmissions are multi-factorial, and the specific rates vary by institution, nearly 20 percent of all Medicare discharges nationwide led to a readmission within 30 days. Preventing even 10 percent of these readmissions could save Medicare $1 billion.
North Carolina’s only not-for-profit, independent community healthcare system, Mission Health, is comprised of seven hospitals, 750 employed/aligned providers, and one of the largest Medicare Shared Savings ACOs in the nation. Mission had been using the LACE index to predict risk for readmission, and while it was helpful, Mission’s patient population was different than the population used to develop the LACE index, leaving the health system with some uncertainty regarding the readmission risk of its patients. With the help of data analytics, Mission developed its own predictive model for assessing readmission risk, aimed at preventing readmissions and improving outcomes for patients.
Hospital readmissions are associated with high financial costs and unfavorable patient outcomes. Reasons for hospital readmissions are multi-factorial, and specific readmission rates vary by institution and patient population. For patients on Medicare, nearly 20 percent end up readmitted less than 30 days after discharge, resulting in a significant financial burden for Medicare payers and healthcare organizations. Preventing even 10 percent of these readmissions could save Medicare $1 billion.1
Many organizations use the LACE index (length of stay (LOS), acuity of admission, Charlson Comorbidity Index, and number of emergency department visits in preceding six months) to predict a patient’s risk for readmission. This risk assessment was developed using data from 4,812 patients admitted to 11 hospitals in Canada between October 2002 and July 2006.2 While the LACE index is widely used, it was developed using data from middle-aged Canadian patients who did not have serious comorbidities. As a result, critics have questioned the validity of the LACE index in its applicability to broader patient populations, and have doubts regarding its predictive accuracy.3,4
Mission Health is western North Carolina’s only not-for-profit, independent community healthcare system. Mission is comprised of seven hospitals, including tertiary, critical access, and inpatient rehabilitation, 750 employed/aligned providers, and one of the largest Medicare Shared Savings ACOs in the nation. In total, the health system employs over 13,000 dedicated professionals.
Mission’s primary goal, also called the “BIG(GER) Aim,” is to get every person to their desired outcome, first without harm, also without waste, and always with an exceptional experience for each person, family, and team member. This statement of intent applies to every individual the health system serves, from patients to clinical staff alike. In an effort to better achieve the goals of its BIG(GER) Aim, Mission looked to reducing readmissions as an opportunity to improve financial outcomes and better serve patients, their families, and staff.
To help facilitate major process improvements, Mission’s centralized performance improvement team, made up of highly skilled process engineering professionals, is utilized to help facilitate major process improvement efforts. This approach had been successful for early transformational efforts. Mission had improved its clinical analytics, achieving significant reductions in sepsis and stroke mortality, LOS for bowel surgery and renal patients, and population screening for breast and colorectal cancer. This was achieved through embedding data-driven insights and improvements into workflows for more than 50 care process models.
However, as projects became more complex requiring higher levels of leadership, particularly from physicians, it became clear that more needed to be done. Mission invested resources to ensure continuous quality improvement over readmissions, which led to demonstrated early success in reducing its all-cause readmission rate.
In order to further reduce readmissions, Mission identified a need to continue to improve the care processes, with the goal of preventing unplanned readmissions. Clinical leaders had been using the LACE index to predict the patients risk for readmission, and while it was helpful, Mission’s patient population was different than the population used to develop the LACE index, leading to questions regarding the predictive accuracy of the LACE index for Mission’s patients. Additionally, Mission was not able to use the patient’s LACE index readmission risk score until after the patient had been discharged, limiting the ability to use the score to inform decision making.
To truly impact unplanned readmission rates, Mission needed to improve its ability to accurately predict the patient’s risk for readmission prior to discharge, and ensure the data was made available to clinicians in a timely manner. To do this, Mission needed machine learning using data specific to its patient population.
Mission decided to launch an integrated analytics team, made up of a data scientist, data architect, knowledge engineer, BI developers, training specialists, quality analysts, and clinical and operational leaders from various parts of the health system. The team’s goal was to use machine learning to drive meaningful clinical predictions.
To create a predictive model for readmission risk, the integrated analytics team followed an outlined process of first clearly identifying the customer (the engaged stakeholder), identifying the problem the customer is trying to solve, and determining the value of the work, including the clinical and business case for a new model. To guide the development of predictive analytics, Mission uses 12 key questions when engaging with stakeholders:
With the problem established and the value confirmed, the team conducts research, performing a literature review and identifying competing models. As part of data discovery, team members identify data sources and determine if new data needs to be collected. After merging and augmenting their data as appropriate, the team performs descriptive analytics, ensuring they understand the descriptive properties of the data. Finally, the team then develops the new predictive model, which is then assessed, trained, and tested for accuracy. Only after thoroughly testing the new model is it then automated and integrated into the appropriate analytic application.
Mission relies upon the Health Catalyst® Analytics Platform and broad suite of analytics applications, as its infrastructure and primary source for data and analytics. The data warehouse enables healthcare organizations to automate extraction, aggregation, and integration of clinical, financial, administrative, patient experience, and other relevant data, empowering organizations to leverage advanced analytics to organize and measure clinical, patient safety, cost, and patient outcomes.
Using the data infrastructure provided by the Health Catalyst Analytics Platform, Mission developed the readmission risk predictor. The analytics platform supported a relatively simple implementation of the new readmission prediction model (see Figure 1).
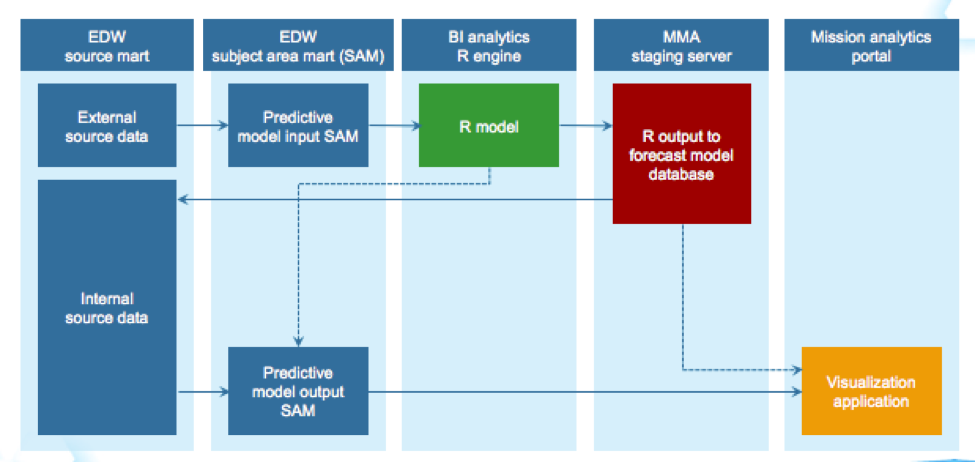
The readmission prediction model was built by using Mission’s patient populations and data assets, including LOS, acute emergent hospital admission, comorbidities, and emergency department visits. By running the model against retrospective data, Mission was able to validate that the predictability of its readmission risk predictor outperformed LACE in Mission’s patient population, and more accurately predicted each patient’s readmission risk.
In a short time, Mission has launched an integrated team to drive meaningful clinical predictive analytics, resulting in the development of an automated predictive model for readmission risk.
Mission is dedicated to further refine its predictive analytics process, to develop and sustain data science projects in support of the BIG(GER) Aim. Mission plans to use predictive analytics for a variety of needs, all in an effort to improve clinical and financial outcomes throughout the health system.