Thirty percent of the entire world’s data is generated in the healthcare industry, with valuable information often locked in the EMR. Many times, time-consuming manual processes are required to abstract the data and transform learnings into a usable format for clinicians and administrators to understand performance, drive operations, and inform improvement plans.
For Orlando Health, the data required by operational leaders to effectively run emergency department (ED) operations were not easily accessible. Obtaining ED performance data at the healthcare system consumed nearly 90 percent of one analyst FTE, negatively impacting the ability to use timely data to drive and improve ED operations and limiting analyst ability to perform more meaningful work. By utilizing its analytics platform, Orlando Health leadership has expanded access and visibility to data to drive improvement efforts. Having gained visibility into near real-time actionable data, Orlando Health is able to plan ED improvement efforts in a timely, meaningful manner.
In the U.S., over 130 million people access the emergency department (ED) each year for care. As a result of increasing patient volumes, EDs must optimize resources to provide care—requiring organizations to measure and improve access to timely care, improve emergency preparedness, and reduce costs of care.1
Of the world’s data, thirty percent is created in the healthcare industry. These data are of tremendous value but are often locked in the EMR, requiring laborious manual processes to abstract the data and transform it into a format that clinicians and administrators can use to understand current performance, drive operations, and inform improvement plans.2
Orlando Health is one of Florida’s most comprehensive private, not-for-profit healthcare networks. Based in Orlando, its seven acute care hospitals serve nearly two million Central Florida residents and 10,000 international visitors, with over 98,600 hospital admissions, 380,000 emergency visits, and 5,200 trauma cases annually. The healthcare network sought a way to improve data accessibility to help advance improvement efforts.
Orlando Health has consistently sought to use data to support improvement, leveraging lean concepts to enhance outcomes and reduce cost. However, data were contained within multiple sources, making it difficult to obtain meaningful information that could be used to drive operations and inform improvement efforts.
The data required by operational leaders to effectively run ED operations were not easily accessible and developing meaningful reports required analysts to manually abstract data from multiple sources. Varying data definitions across several sources resulted in discrepancies, causing clinicians to doubt the validity of data.
Access was limited to specific users who had the knowledge and skills required to abstract data, limiting its use to drive decisions across the entire organization. Non-analyst users were limited in the type of data they could obtain, and reports were not stable. Users could attempt to gather data for an entire month or several months, but the return of that data was inconsistent. The requested information may be received a couple of hours after submitting the query, although typically the report would time out and never return the data of interest.
Leaders and improvement specialists reached out to analysts, who would then manually abstract the requested data, copy and paste it into a spreadsheet, and then manually create visualizations so the information could be consumed and understood by others. Analysts spent multiple days per week obtaining data, restricting their ability to perform more meaningful work.
Time constraints, limited data visibility, and file size limits negatively impacted improvement efforts. Delays, limited ability to analyze trends and make comparisons over time, or to analyze differences between locations and providers, restricted the organization’s capabilities to use data to drive and improve ED operations. The Orlando Health leadership desired a sophisticated analytics solution to improve visibility and access to data to drive improvement efforts.
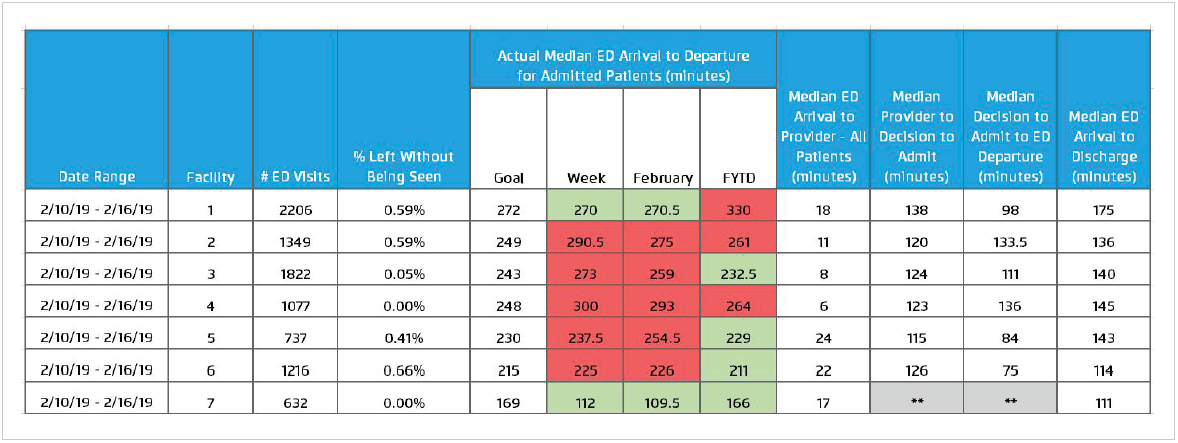
To improve data accessibility and visibility, Orlando Health invests in the Health Catalyst® Data Operating System (DOS™) platform, and a robust suite of analytics accelerators, including the Department Explorer: Emergency Services Analytics Accelerator to provide sophisticated analytics, engendering data-driven operations. The analytics accelerator pulls data from the analytics platform into a user-friendly visualization, which displays the ED data necessary to track, trend, and predict resources required to deliver high-quality emergency care. These visualizations are easy to understand and support operational leaders in using data to drive operations (see Figure 1).

The analytics accelerator serves as the organizational source of truth and is used to understand ED performance. To eliminate data discrepancies and improve clinician confidence, standard definitions within the analytics accelerator define each metric and the sources of data for each, including arrival times, door to provider, door to discharge, and door to disposition, improving confidence in the data and willingness to use the data to drive improvements. Near real-time information is accessible to operational leaders, clinicians, quality improvement specialists, and analysts, who can drill down and make comparisons over time.
Armed with visibility into timely actionable data, emergency services clinicians can analyze ED volumes by day of the week, month of the year, and hour of the day. Orlando Health can identify sub-cycles for overall length of stay, as well as track, trend, and predict resource utilization. The organization can also analyze the impact of ancillary services on department throughput and quality. Accountabilities are clearly assigned for each process that patients encounter.
Using the analytics accelerator, operational leaders no longer wait weeks or months for reports, instead making data-driven continuous improvement a part of daily work. Leaders use the analytics accelerator to review the previous day volumes and throughput measures, enabling better planning for the day-to-day operations and are better able to adjust to meet patient needs. Data is integrated into the ED’s visual management system and used as part of daily quality huddles. Teams receive immediate feedback regarding performance, with the data illuminating where they have achieved the organizational goal and where they still have room for improvement (see Figure 2).
Orlando Health engages frontline clinicians in its improvement work. The analytics accelerator is readily available for access on most devices in the ED. End-users participate in a 20-minute personal training session, ensuring they understand how the analytics accelerator works and have the skills to use data as part of their routine activities.
The improvement team is now able to use the analytics accelerator to drill into performance data during team meetings and can develop an action plan in under 30 minutes, leading to more nimble responsiveness to improvement efforts. Teams can also immediately evaluate the impact of improvement plan interventions on outcomes. In one instance, Orlando Health piloted a trial of a provider in triage to reduce wait times. The organization questioned which type of provider would be best suited to fill that role, so it completed two pilots with different provider types. Incorporating data within the analytic application at weekly meetings, the benefits of the staffing change and the role that leads to the greatest improvement became clear. Use of a provider in triage is now standard practice across the system.
Having gained visibility into near real-time actionable data, Orlando Health is able to plan ED improvement efforts in a more timely and meaningful manner. The healthcare network has experienced a substantial reduction in time required to obtain performance data and visualizations, including a:
Improved access to data has also provided Orlando Health new insight into its performance, allowing leaders to better prioritize improvement efforts and enhance daily operations. The organization can ask, and answer, more sophisticated questions than it was able to before, eliminating the delay between a question being asked and when it is answered.
“We spent a lot of time looking for areas to improve but without a clear source of data to guide our improvement efforts projects were selected based on opinion rather than actionable data. We now use data to drive our operations, helping us to take care of our patients in a timely manner without delays.”
– Carlos Carrasco, MBA, Vice President of Operations Orlando Health, Orlando Regional Medical Center
The Orlando Health emergency services team has already made substantial data-driven adjustments to operations to better align with changing patient volumes. It plans to further improve the use of data and analytics to facilitate data-driven improvements, leveraging the entire healthcare system to collaborate and improve ED throughput.