Like most large healthcare systems throughout the country, Allina Health’s financial health improves dramatically by optimizing inpatient care for the patients it serves.
Allina recognized optimizing length of stay (LOS) was one of the key drivers of its inpatient financial performance and developed the technical infrastructure and analytic capabilities to understand LOS performance by the minute and not the day; adjust LOS to account for patient acuity and compare performance to national benchmarks; make LOS data available to clinicians across the organization in near real-time; and estimate the financial impact of LOS opportunities to enable targeted interventions for improvement.
Allina leveraged its enterprise data warehouse (EDW) and analytics platform and optimized LOS, yielding the significant results in the first two years of its improvement efforts.
Hospital inpatient care makes up nearly one-third of all healthcare expenditures in the United States, and represents a significant impact on the country’s economy.1 Length of stay (LOS) is an aspect of care that can be costly for most healthcare systems if not approached the right way.
As one of the largest healthcare systems in the Upper Midwest, serving 41 communities with 13 hospitals and 61 clinics, Allina Health knew that if it could reduce length of stay while continuing to deliver high quality care, it could realize significant cost savings.
Optimizing LOS was a strategic priority for Allina, but there were two main reasons its analytic and technical capabilities did not previously enable the organization to improve performance and reduce LOS:
Allina’s primary challenge was the inability to identify meaningful opportunities for improvement across the organization. The three contributing factors were Allina’s inability to (1) access detailed and accurate LOS performance data, (2) adjust LOS opportunities for patient severity of illness and benchmark its performance, and (3) estimate the financial impact of LOS opportunities.
LOS calculation and reporting
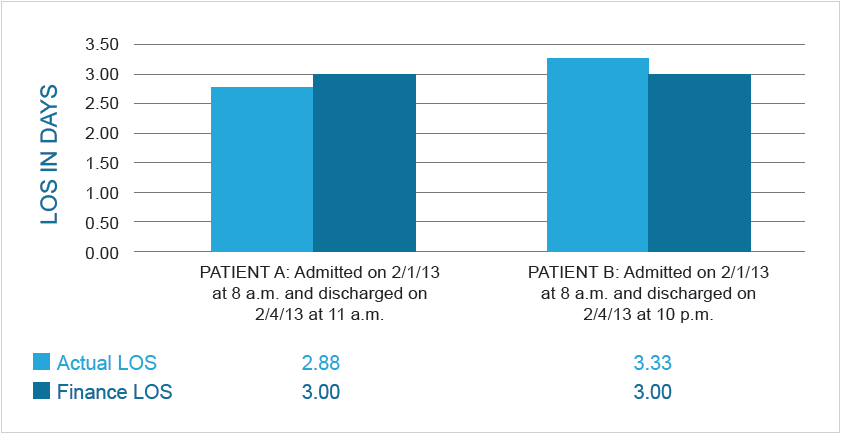
The traditional method for calculating and reporting LOS in the past 20 years was through the financial and claims infrastructure. Using this method, the finance LOS was calculated and reported in whole days from admission date to discharge date. While accurate, this method did not take into account that patients enter and leave the hospital at different times of the day. For example, a patient discharged at 11 a.m. and a patient discharged at 10 p.m. on the same day would both be calculated as one day, even though the 11 a.m. discharge opened up hospital bed capacity for 11 additional hours (see Figure 1).
Due to the traditional method for calculating LOS, Allina was unable to understand true LOS performance and variation, and unable to identify meaningful opportunities for improvement.
Adjusting LOS for patient acuity or illness severity
Allina was also unable to adjust for patient acuity or severity of illness, a capability required for the organization to deploy its resources appropriately and to identify LOS opportunities that compared similar patients. Allina’s traditional method to adjust for patient acuity for each diagnosis-related group (DRG) of patients was to divide the average LOS by the average case-mix index (CMI), a value that reflects the clinical complexity and resource needs for each DRG of patients. This method was ineffective because although a relationship existed between LOS and CMI, it wasn’t linear. For example, pneumonia patients without a complicating diagnosis and spinal fusion patients without a complicating diagnosis have a similar average LOS nationally, but very different CMIs (see Figure 2).
Medicare Severity Diagnosis Related Group (MS-DRG)Simple Pneumonia without a complicating diagnosis (MSDRG 195)Spinal fusion without a complicating diagnosis (MSDRG 455)Geometric Mean LOS (GMLOS)2.8 days3.0 daysCase-Weight Index (CMI)0.7116.193Figure 2: Variability of Case Mix Index of Patient Groups with Similar Average Lengths of Stay
This example demonstrates that CMI is indicative of how expensive each patient group is and not just the expected LOS. Using this method, Allina was unable to adequately adjust for patient acuity and benchmark its performance against others, leading to an inability to identify meaningful opportunities for improved LOS
Estimating financial impact of LOS
Finally, Allina could not estimate the financial impact of LOS opportunities. Without knowing the financial impact of various LOS opportunities, it was unable to target interventions for improvement in areas that made sense clinically—and financially—for the organization.
Allina was unable to improve performance and reduce LOS because it could not adjust its clinical decision making while patients were hospitalized. The majority of providers, care team members, and leaders across Allina lacked access to LOS data.
There was also limited demand for the data because it was not clinically relevant. The process for gathering and sharing LOS data was very resource intensive and Allina lacked the staffing resources needed to adequately disseminate available data across the organization. In addition, when LOS data was available and provided, it was often provided several weeks or months after patients were discharged from the hospital. Significant lag times prevented improved performance while patients were still hospitalized and resulted in limited provider engagement.
Leveraging a Late-Binding™ Enterprise Data Warehouse (EDW) and Health Catalyst Analytics Platform, Allina deployed six key changes during the course of one year to address the shortcomings of previous approaches.
First, Allina developed the inpatient data mart so relevant data was available to the organization. The inpatient data mart held individual patient information from the electronic health record (EHR), including data on demographics, diagnoses, timestamps throughout care processes and pathways, and billing information. Key stakeholders, such as the hospitalists, were easily engaged in developing the inpatient data mart because it provided access to clinically actionable data previously unavailable.
Second, Allina implemented a new method for measuring performance that adjusted for the severity of illness for one patient compared to another. This method ensured LOS of a very sick patient was not compared to the LOS of a healthier patient. The new performance measurement method used groups of related patients in the hospital or Medicare-Severity Diagnosis Related Groups (MS-DRGs). Each MS-DRG had a national average LOS, known as the geometric mean LOS (GMLOS), and the GMLOS was used as a benchmark for Allina to compare its acuity-adjusted performance externally. Allina compared its LOS performance with the national average to identify improvement opportunities by dividing each patient’s actual LOS with the MS-DRG-specific GMLOS to identify LOS opportunities (see Figure 3).

Third, Allina created performance reports for individual sites, provider groups and individual providers, clinical service lines, nursing units and ancillary departments, quality departments, and leadership across the organization. Through the analytic capabilities made possible by Allina’s EDW and inpatient data mart, Allina identified the following opportunities for improvement.
Discharge Orders
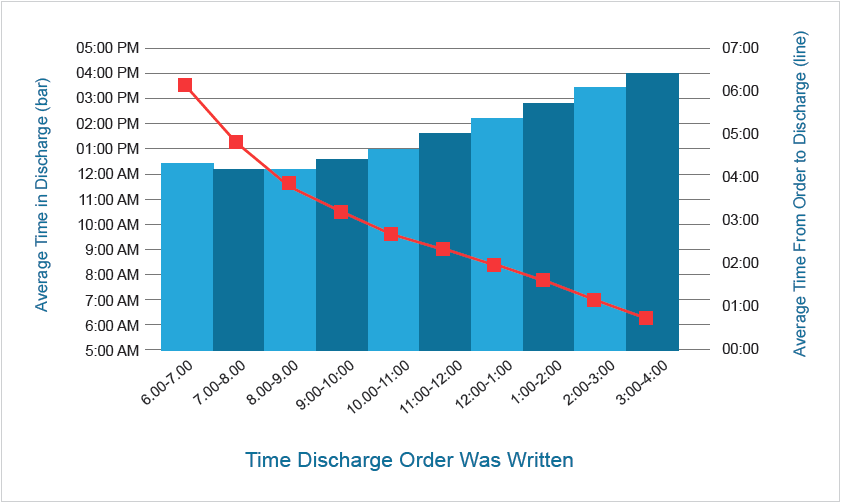
Through its performance reports, Allina discovered that the time discharge orders were written had a smaller impact on the actual discharge time than previously thought. Prior to having data at this specificity, LOS improvement initiatives were focused on having the hospitalists write discharge orders first thing in the morning before they rounded on the rest of their patients. Performance reports revealed that many hospitalists already completed discharge orders in the early morning, but patients were rarely discharged before noon regardless of when orders were completed (see Figure 4). Through observation of clinical workflows and discharge processes, Allina identified opportunities including the following:
Practice Pattern Variation
Performance reports confirmed significant practice pattern variation of the hospitalists with LOS differences across all clinical conditions. The ability to view specific performance data down to the individual provider level motivated providers and their peers to achieve higher performance, thus enabling Allina to identify achievable opportunities for improvement with strong provider buy-in.
Delayed Discharges
Performance reports revealed that LOS varied by day of the week. Data suggested inconsistent resources and more avoidable hospitals days on the weekends. Through detailed analysis, Allina identified limited availability of diagnostic procedures and difficulty in discharging patients to SNFs on the weekends as two key reasons for delayed discharges.
It was important for Allina to quantify benefits and estimate the financial opportunity as best as it could, and Allina knew the most expensive parts of hospital stays were the admission and discharge processes, regardless of the LOS. To attempt to quantify the overall cost of saving a day of hospitalization, Allina started with hospital stays in its medical or surgical units with four-day lengths of stay and focused on estimating expenses from day three of the four-day hospital stays because these expenses were most representative of the savings expected from reducing LOS. Allina developed a complex formula that estimated the bottom line impact to the income statement. Using conservative -calculations that included only direct supplies and partial labor, cost savings were estimated at a conservative rate of $500 per day, and once Allina knew the estimated cost savings per day, it was able to quantify opportunities and impact.
Allina accelerated and dramatically improved LOS performance because of the clinically relevant and actionable data available in near real-time. It engaged the hospitalists through frequent reporting of LOS performance data, by provider, in a way that was transparent and non-accusatory. As LOS initiatives progressed, this data led to clinical transformation and less practice pattern variation, thereby reducing overall LOS.
Hospitalists partnered with multidisciplinary team members to develop a consistent discharge planning process and established communication expectations with all team members involved in the care of their patients. By developing a standardized process, team members were consistently informed of the anticipated discharge date and when discharge orders were complete. The multidisciplinary team identified the highest volume SNFs patients were admitted to, and partnered with leadership at these SNFs to develop transfer agreements and availability standards for weekends. The highest volume SNFs agreed to accept more patients on the weekends and Allina care teams agreed to standardize the patient information and discharge instructions sent with each patient to the SNF.
Data available through Allina’s EDW and inpatient data mart created an insatiable demand for detailed performance data across the organization. Allina needed a new way to provide information to all constituents that was scalable and did not require adding additional resources. Given these constraints, Allina created the inpatient dashboard, a business intelligence solution that provided the following:
Allina had two critical success factors in optimizing its LOS. First, providers across the organization supported the data and believed in its accuracy due to the specificity, acuity adjustment, and benchmarking available. Providers had strong buy-in to the data and analytic capabilities and championed efforts with multidisciplinary team members to dramatically improve performance. Second, the inpatient dashboard eliminated bottlenecks in getting clinically relevant and actionable data into the hands of providers in a financially viable way. Allina’s scalable capabilities provided the organization with transparent data that did not require hiring additional resources.
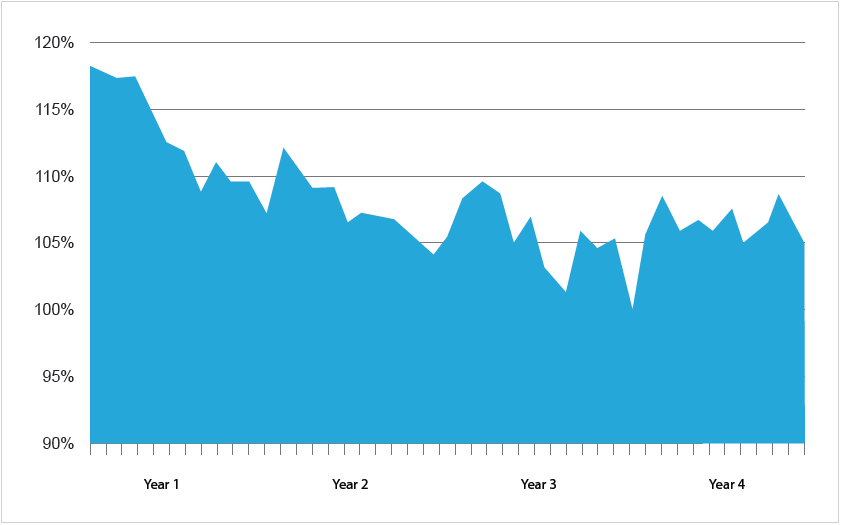
Allina has seen dramatic improvements in LOS in its initial years and has maintained performance nationally as other health systems simultaneously work to optimize LOS performance (see Figure 5).
Based on the LOS improvements made, Allina achieved significant results in its first two years:
Allina’s EDW and analytics platform enabled data availability and impacted all aspects of care delivery from the administrative offices to the patient’s bedside. The results achieved and money saved ensure Allina will continue to serve people within its communities each and every day.
“LOS improvement is an initiative that has both financial and quality benefits. It takes long-term commitment from multidisciplinary clinical teams who are provided regular data and dashboards to make sustainable improvement. There is no method that adds capacity faster than working on progression of care. And most patients are not asking to stay in the hospital longer!”
– Dennis O’Hare, MD, LOS Executive Sponsor
Length-of-stay management has become intertwined within general organizational performance at Allina. With the access to data and the developed infrastructure, LOS optimization has moved into ongoing support stages. Data continues to be used to identify opportunities, monitor current performance, and prioritize efforts. Additionally, the values used to calculate performance to GMLOS are updated annually based off of the updated CMS values released in the fourth quarter of the year. Annually updating these values helps Allina to understand and put national performance changes into context.