Revenue Cycle Advisor: Hospital
Product Overview
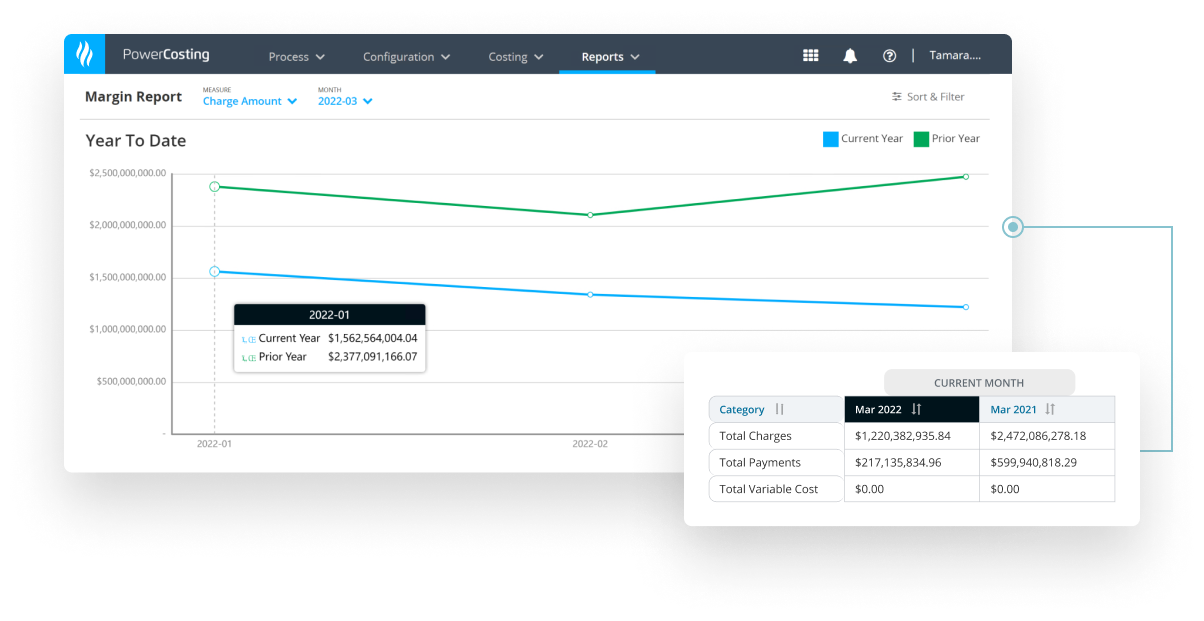
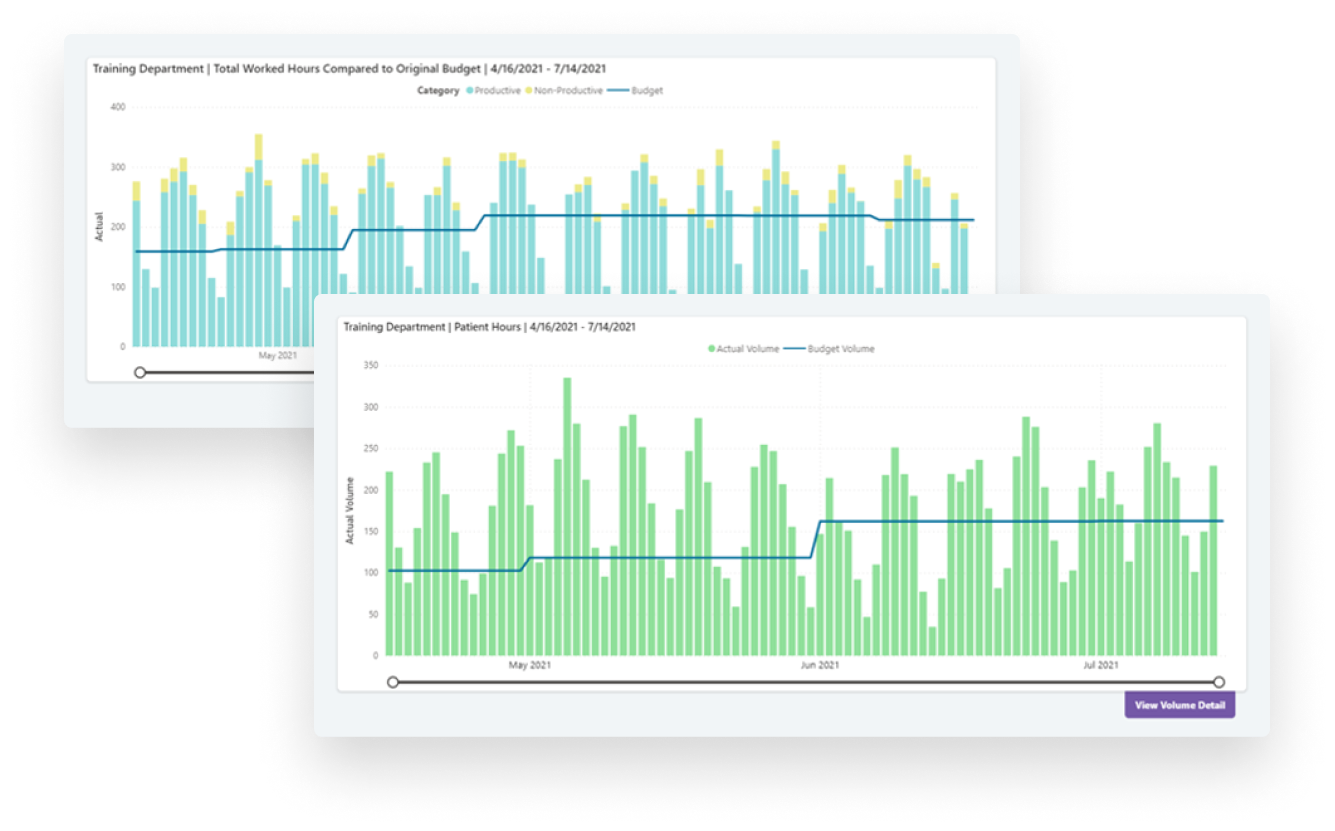
Revenue Cycle Explorer is a reporting tool that allows revenue cycle decision makers and analysts to quickly and easily identify trends and variances, pull ad hoc reports and address root causes of performance issues. Metrics include: denials management, accounts receivable, charge and cash trends, write offs, gross and net collection rates.
Features
- Drill down capabilities to the payer, provider, location and CPT level allow for true root cause analysis
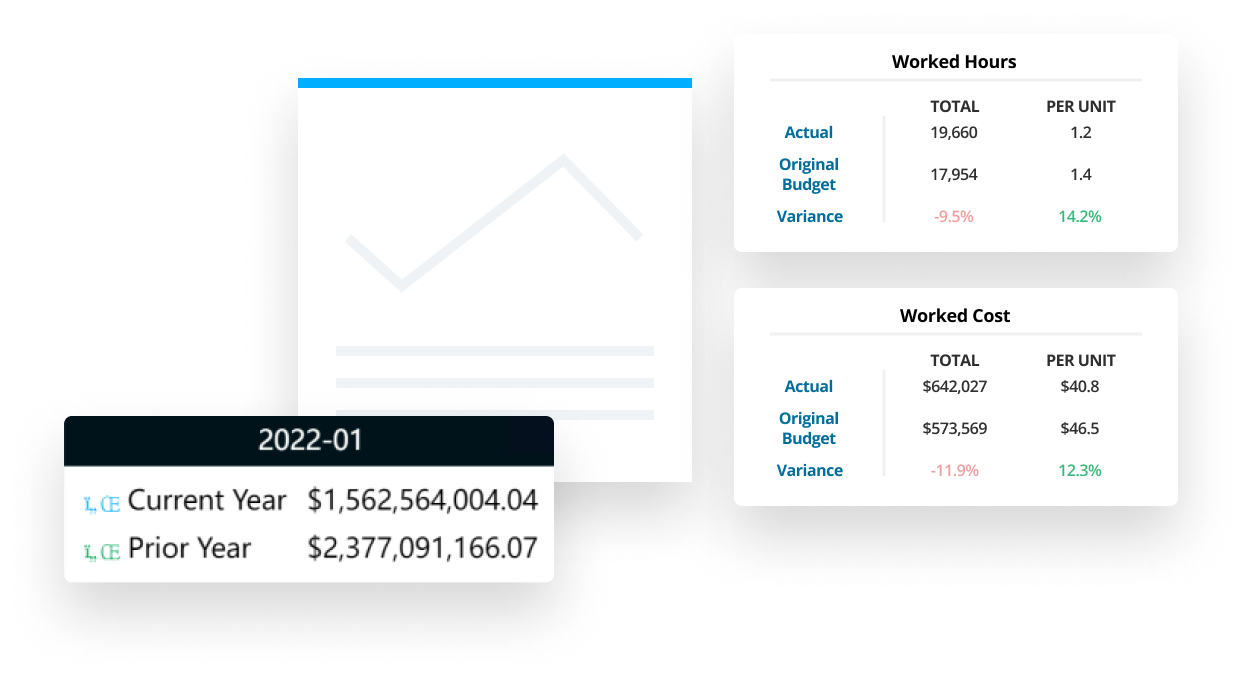
- Built in comparisons and variances give instant insight to performance
- Application is automatically refreshed as new data is available.
- Guided navigation and drill down provides answers to the next series of questions typically asked by the user. Drill down typically extends as far as patient or transaction level which results in an actionable dataset that can be worked or validated.
Benefits
Benefits include:
- The application is automatically refreshed as new data becomes available allowing for a paradigm shift in AR management from a reactive approach to one where potential issues and processes are corrected before they have a chance to affect cash flow or become a compliance risk.
- Frees up analyst/decision support time by providing timely and accurate reports and empowering users to find answers on their own through deep drill down analysis
- Single source of truth for key revenue cycle metrics
Measures
Measure | Dimensions |
Charges, Payments, Adjustments | Location, Financial Class, Provider, Post Period MTD or YTD Compare to prior period, workday adjusted prior period or budget |
Payer Mix | Location, Post Period/AR Report Date View by Charges posted or Accounts Receivable |
Write Offs (Bad Debt, Charity, Operational Write Offs) | Location, Financial Class, Payer and post date |
Total Accounts Receivable | Location, Financial Class, Provider, AR Report Date, Discharge Period View as Dollars or # of Accounts Aging Category: (0-30, 120+, etc.) Account Balance Category: <$0, $1k-$9k, $10k+, etc.) Time Frame: Rolling 12 or compare to prior year |
Days in AR | Location, Financial Class, Provider, AR Report Date Time Frame: Rolling 12 or compare to prior year |
Net Collection Rate | Financial Class, Payer, Discharge Period Months from Discharge (trend how well you recover payments) |
Gross Collection Rate | Financial Class, Payer, Discharge Period Months from Discharge (trend how well you recover payments) |
Denials | Count of denials and $ denied by Denial Category, Denial Code, Payer, Location, Provider, CPT Code (for professional only) |
Data Sources
- General Financial
- Billing and Accounting
Background & Problem Summary
Health care providers work in a challenging environment with rising costs of care, decreasing patient volumes and an evolving reimbursement model. One controllable aspect of the business is collecting every dollar that they are entitled to. However, complex billing rules from dozens of payers, convoluted regulations, and greater reliance on patients for payment combined with antiquated financial reporting has led to millions of dollars of lost revenue. Revenue Cycle Explorer gives decision makers timely access and visibility to the data that matters most – allowing them to drive change and succeed in this complex reimbursement environment.
Anticipated Improvements
- Drill down capabilities to the payer, provider, location and CPT level allow for true root cause analysis
- Built in comparisons and variances give instant insight to performance
Success Measures
Opportunity Identification:
- Ability to show net collection rate variance of up to 7% between facilities of a healthcare system.
Process Improvement:
- By year end, reduce workload of centralized BI team by 20% by providing timely, accurate and actionable data to end users.
Outcomes Improvement:
- Lowered timely filing write offs for Medicaid payer by $1 million in six months.