This comprehensive guide includes 12 frequently asked questions about Merit-based Incentive Payment System (MIPS) quality measures. This guide will help increase your understanding of MIPS quality measures so you can choose the best quality measures for your team. Find answers to your questions, including:• Where can I find a list of MIPS quality measures?• What are specialty measure sets and how do they categorize MIPS quality measures?• What are submission methods for MIPS quality measures?• How are benchmarks used to score your performance in MIPS quality measures?• What is the burden of different MIPS quality measures?
 Download
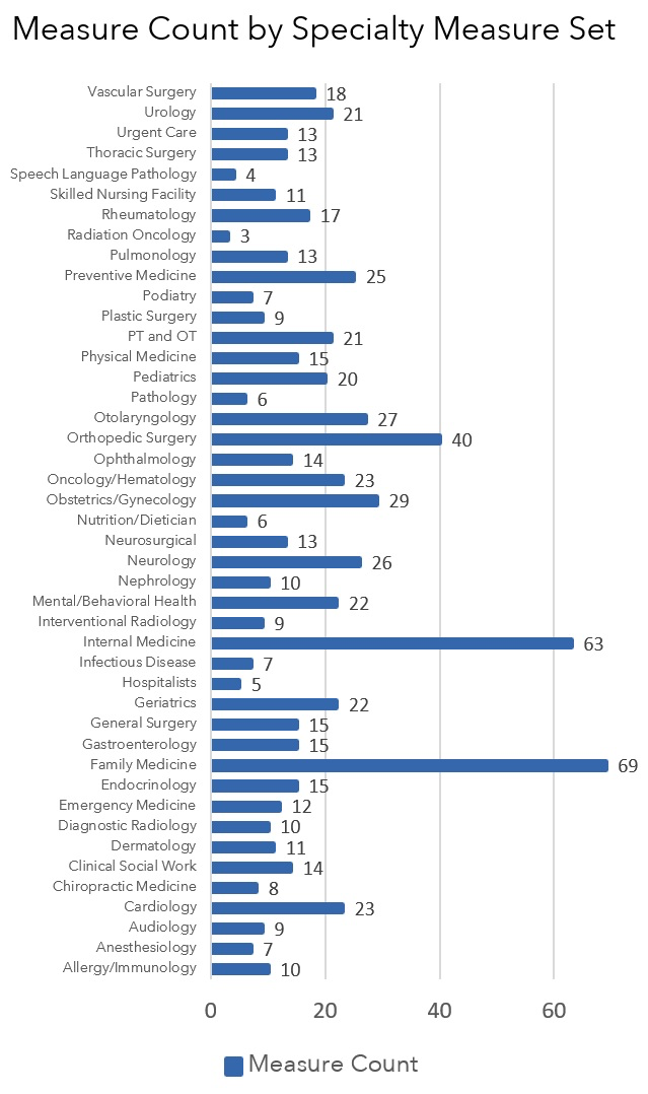
This guide includes 12 frequently asked questions about Merit-based Incentive Payment System (MIPS) quality measures. Use these 12 questions and answers to increase your understanding of MIPS quality measures and choose the best MIPS quality measures for your team.
Download the full list of MIPS 2020 quality measures from Able Health™. After downloading the list, you can filter by specialty-measure set, submission method, measure steward, measure type, and more (figure 1).
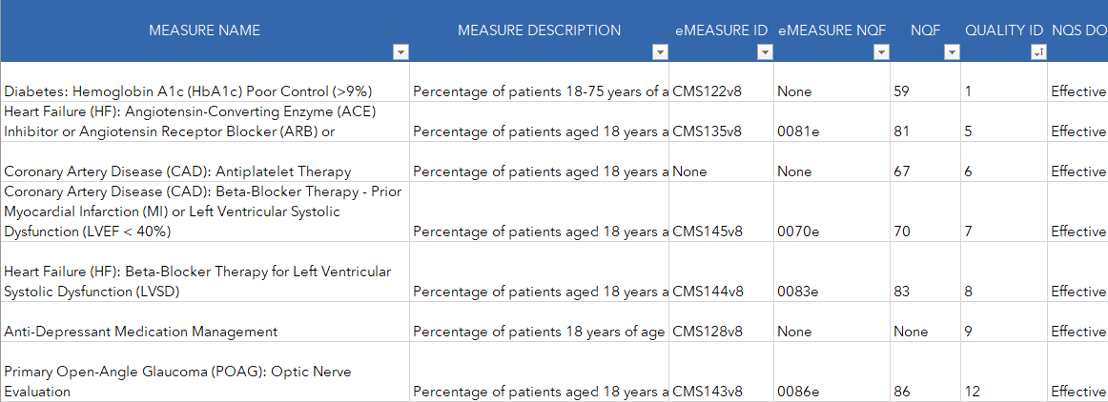
Not familiar with specialty-measure sets, measure stewards, and measure types? Keep reading and learn everything you need to know.
Specialty measure sets categorize the 219 MIPS quality measures in 2020 by specialty. Specialty measure sets include measures that relate to a clinician’s expertise and regular practice. Some specialty measure sets include more measures than others (figure 2).
Measures in a specialty measure set are relevant, but not unique, to that specialty. For example, the specialty set for orthopedic surgery includes Measure 130: Documentation of Current Medications in the Medical Record. Measure 130 is relevant, but not unique to orthopedic surgery.
While specialty measure sets help you find measures relevant to your specialty, know that your best measure(s) may be outside of your specialty measure set. You are not limited to the measures in your specialty set. And your highest performance might be in a measure not in your measure set.
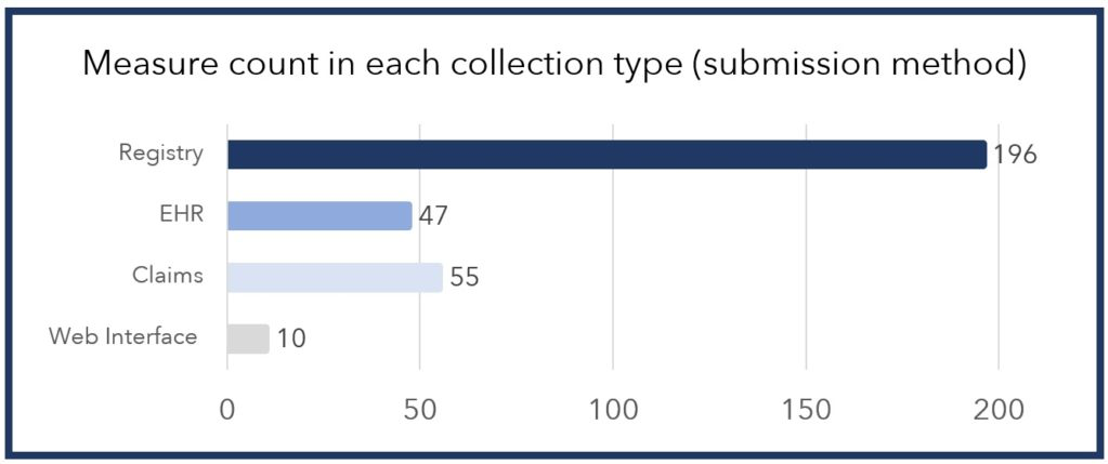
MIPS participants report MIPS quality measures using submission methods. MIPS offers four submission methods for MIPS quality measures: claims, EHR, registry, and the CMS Web Interface. No submission method can report all 219 MIPS quality measures. However, you should know that some submission methods offer more measures than others. Registry submission can report the most measures, often including 100 percent of measures in a specialty measure set. Here’s a comparison of measures counts for each submission method (figure 3).
You’ll find this same discrepancy in each specialty measure set. Your submission method may or may not include all the specialty-specific measures your physicians prefer. Below is a snapshot of the discrepancy across specialty measure sets (figure 4).
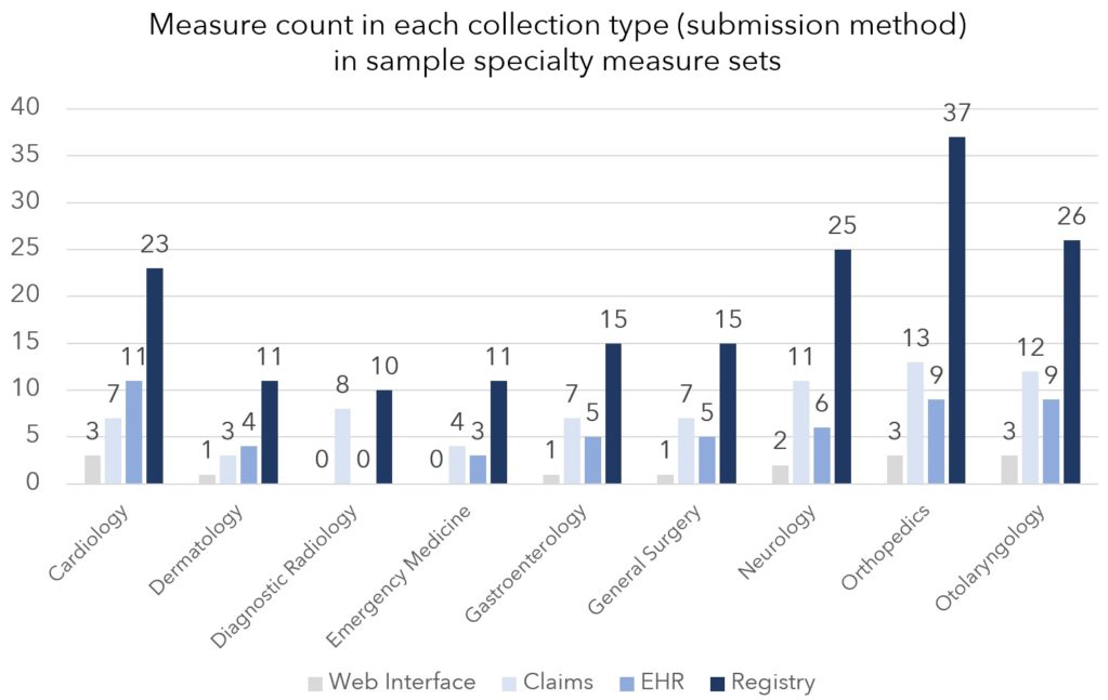
Different submission methods offer different measure counts for each submission method. For example, the gastroenterology specialty measure set includes 15 total measures. Within that set, EHR submission includes five of 15 measures. And registry submission includes all 15 measures–10 extra measures. Gastroenterologists submitting through a registry can report those extra measures. However, gastroenterologists reporting with an EHR cannot submit those 10 extra measures. Those extra registry measures are unique to gastroenterology, making them preferable to gastroenterologists in most cases.
The extra measures offered by registry submission are normally specialty-specific measures. And that’s how submission methods may include or exclude specialty-specific measures your physicians prefer.
So, when selecting your MIPS quality measures, pay attention to what measures you can report through the submission method you plan to use. If the measures your physicians would prefer are not available for reporting through that submission method, you should re-select your submission method.
Measure denominators identify the number of patients eligible for a MIPS quality measure. Measure specifications identify eligible patients using age range, gender, diagnosis, treatment, procedure, and other factors. Broad criteria, like age, increase the number of patients eligible for a measure. On the other hand, narrow criteria, like low-volume procedures, decrease the number of patients eligible for a measure. Be aware of the implications of broad and narrow criteria.
Similarly, narrow criteria compartmentalize patients by specialty. That’s helpful if your specialists want specialty-specific measures, but you report as a group for a multi-specialty team. For example, your cardiologists won’t have to worry about measures with narrow denominator criteria like chemotherapy and your oncologists won’t have to worry about measures with narrow denominator criteria like Coronary Artery Bypass Graft (CABG).
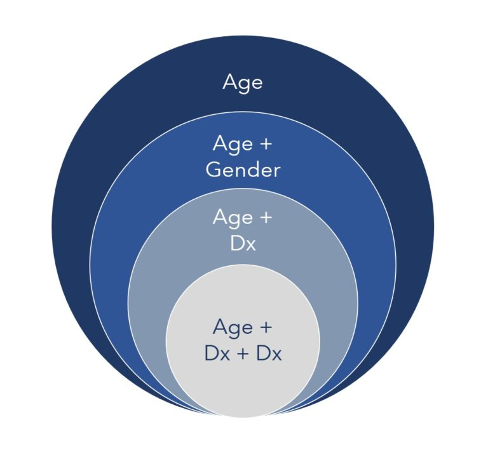
Below are criteria examples, moving from broad to narrow:
Numerators are calculated for MIPS quality measures using the measure’s specifications. The measure’s specifications define when it’s too late to fulfill a measure (case unit) and what data can be used to calculate each measure (collection types).
In every quality measure, a measure case has a particular unit. These units include patients, periods, episodes, encounters/visits, and procedures. These units also determine when it is too late to complete a measure within the performance period (figure 6).
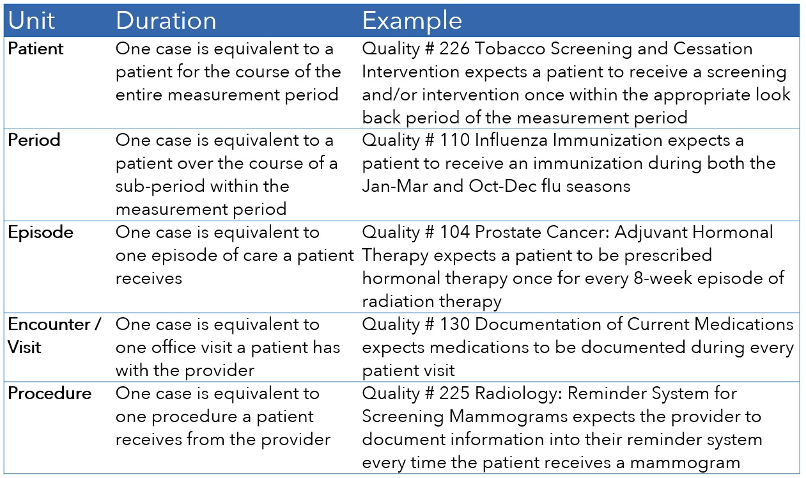
While all measures must be completed in the MIPS performance period, some measures have to be completed sooner than the end of the performance period.
With patient-based measures, you’ll find an additional caveat. You need to look at whether the numerator event can be completed: A) anytime in the measurement period, B) within some time frame relative to any encounter, or C) at the most recent encounter or assessment.
When selecting MIPS quality measures, you’ll want to consider the unit for each measure case in conjunction with the benchmarks for the measure. Some measure benchmarks have blank deciles. In these measures, you can lose between two and seven points if your performance percentage drops from 100 to 99.99 percent. You can recall patients and complete numerator events in measures with patient and period units. Doing so would bring your score back up to 100 percent and regain your two to seven points. On the other hand, you can’t recall patients to complete numerator events in measures with episode, encounter, and procedure units.
CMS defines collection types as “a set of quality measures with comparable specifications and data completeness criteria.” The key word in that definition is “specifications.” The word “specifications” is key because measure specifications dictate what data in your PM or EHR can be used to calculate measure results. And in that way, collection types dictate what data can and cannot be used to calculate your measure results.
You must carefully collect numerator data in your PM or EHR where prescribed by your collection type. That’s because you can’t get credit for qualifying numerator data you collect outside of the data parameters dictated by the collection type. That’s true for every collection type except for CQMs, the data collection for registry submission. Registry submissions can customize the discrete data fields used for reporting. If reporting with a registry, talk to your registry representative about what data fields you use to capture numerator data.
Each submission method has one collection type. However, one quality measure may have multiple collection types. That’s because the same quality measure can be reported by more than one submission method. Figure 7 below that explains the hit-and-miss reality across submission methods (like the game of Battleship):
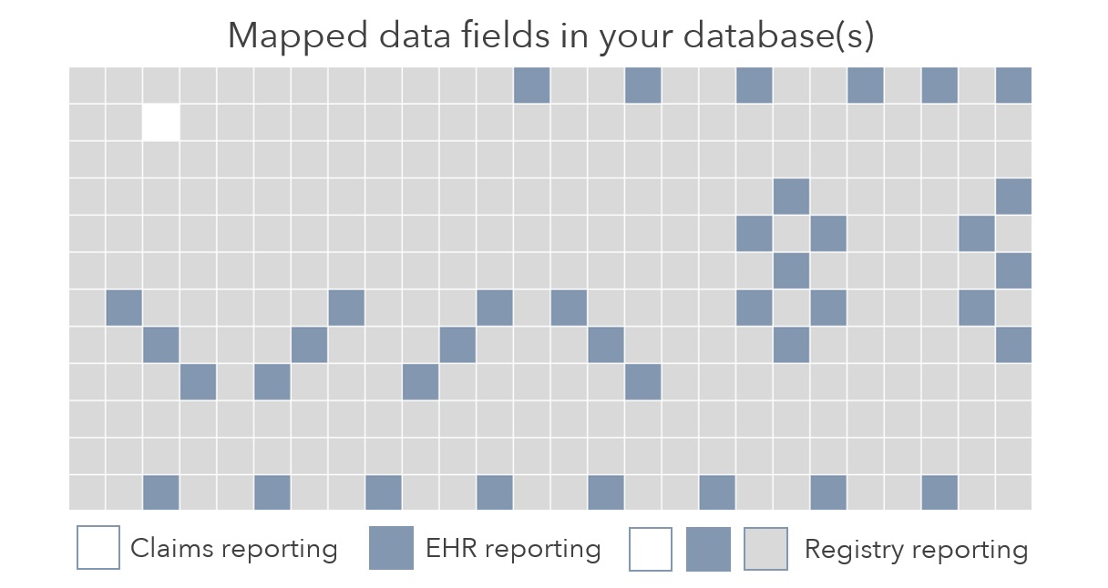
If you use claims to report your quality data, only data documented in claims will report to CMS. Similarly, if you use your EHR file to report your data (the QRDA), only data documented in your EHR’s mapped data fields will be reported to CMS. In the example above, blue boxes represent those data fields. Data captured outside those mapped data fields will not be reported to CMS. And that decreases your performance. Finally, registries like Able Health have the option to use all discrete data fields in your PM and EHR. However, be aware that not all registries use all data fields.
As you would imagine, the use of different data between submission methods (and their corresponding collection types) creates different performance results. Consider this example comparing two submission methods for the same measure (figure 8):
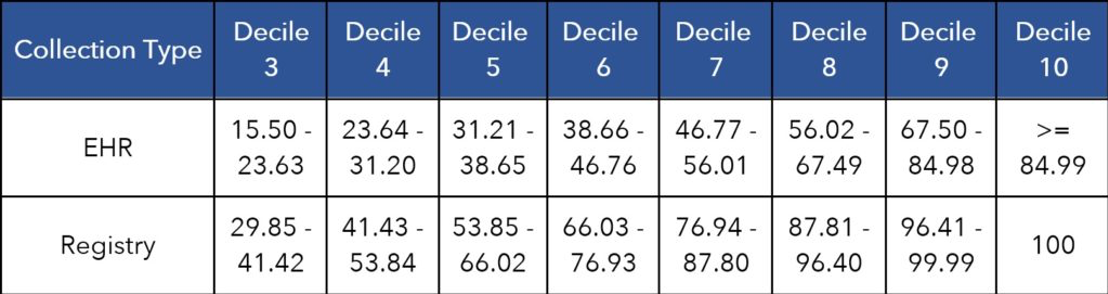
The comparison shows that registry submission performs higher than EHR. The 90th percentile of clinicians reporting this measure with an EHR performed between 67.60 to 84.98 percent. On the other hand, the 90th percentile of clinicians reporting this measure with a registry performed between 96.41 to 99.99 percent. The difference is likely due to the fact that registry submissions can use more data when calculating measure results.
No submission method represents a universal scoring advantage. However, at the end of a year, you might notice a scoring advantage. CMS allows you to submit using the collection type most advantageous to your score.
Beyond scoring advantages, the registry collection type represents a universal time savings. That’s because the registry can adapt to the physician’s documentation rather than the physicians (or coders) adapting to reporting requirements.
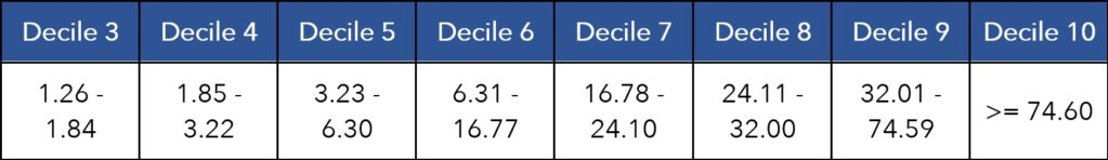
Benchmarks divide provider performance for each measure into 10 parts. Those ten parts are called deciles. Each decile represents the performance for 10 percent of providers in a previous year of MIPS. The achievement points you earn for each MIPS quality measure depends on where your performance falls in a measure’s deciles. Each decile number equals the number of points your performance earns.
For example, a final performance falling into decile 8 earns between 8.0-8.9 performance points. A performance of 98 percent would land in decile 8 in the example below (figure 9):

Different measures have different benchmarks. Some are very different. Those differences create confusion, causing some MIPS leaders to make two common mistakes when reviewing measures and their benchmarks.
Many people believe high benchmarks reflect a difficult measure. Consider this example (figure 10):

People believe these benchmarks reflect a difficult measure. However, this is an easier measure and the benchmarks prove it. Each decile represents the actual performance of 10 percent of providers in previous years. With that in mind, the benchmarks show that 70 percent of clinicians finished at 100 percent in previous years (deciles 4-10). These benchmarks do not create a standard of perfection; they reflect perfection for 70 percent of providers who scored 100 percent.
Many people believe low benchmarks reflect an easy measure. Consider the next example (figure 11):
People believe these benchmarks reflect an easy measure. However, this is a more difficult measure and the benchmarks prove it. Remember that each decile represents the actual performance of 10 percent of providers in previous years. With that in mind, the benchmarks show that 70 percent of clinicians did not perform above 25 percent in a previous measurement period (up to decile 7). These benchmarks show that 70 percent of providers had difficulty with this measure.
While you should review benchmarks when selecting MIPS quality measures, you should also know that you can’t gain a scoring advantage by cherry picking measures based on their benchmarks. Benchmarks are set by past clinician performance. That means your performance is compared to the performance of other clinicians, not an arbitrary scoring standard. That’s also true as it relates to one measure with two collection types. The two benchmarks were set by clinicians reporting the measure with either the same limitations and advantages.
Beyond each measure’s benchmarks, CMS uses many other factors to determine the achievement and bonus points you earn for each measure. The list of factors includes: the presence or absence of benchmarks, a seven-point cap on topped-out measures, a high-priority designation, a bonus for end-to-end reporting, data completeness criteria, and case minimums.
You can see some of these factors in the scoring example below (figure 12):
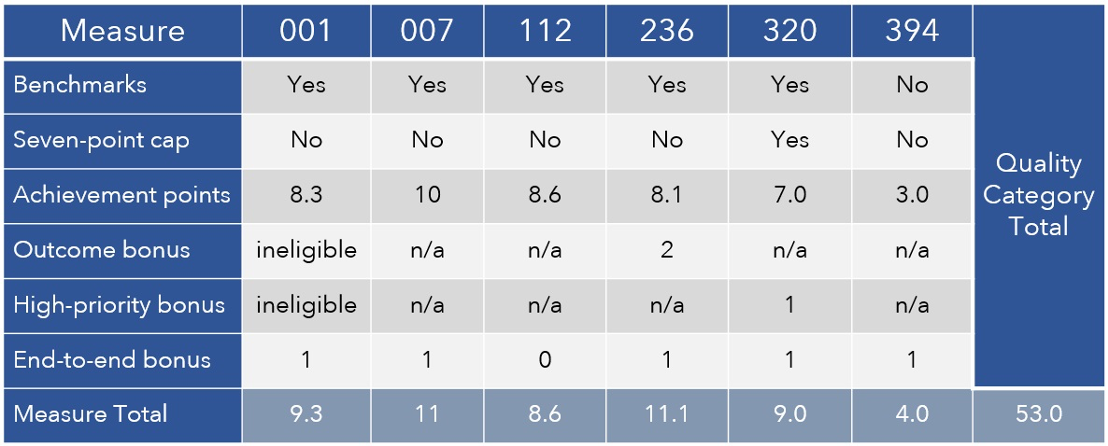
In addition to measure achievement points, your measures may earn bonus points. You earn bonus points on both your highest-performing six measures and any additional measures you submit that qualify.
Some measures represent a significant burden to your clinicians. On the other hand, some measures add no additional burden. Those measures simply quantify what is already in place. When choosing MIPS quality measures, consider the burden on physicians to complete the measure.
Here are some examples of measures that quantify clinical quality without adding a burden to your clinicians:
Documentation varies by measure and the measure’s submission method. Some measure documentation burdens your clinical team and some doesn’t. Consider the documentation differences between measures and make sure your team can keep up. Documenting the measure is just as important as doing the measure. That’s because, like in medical billing, “if it wasn’t documented, it wasn’t done.”
When choosing MIPS quality measures consider the differences between measures and collection types (submission methods).
Some measures require clinicians to document several data points. Other measures don’t. Balance the opportunity and the opportunity cost of each measure.
Different submission methods use different data fields for the same measure. This question returns to an image shown previously in this guide:
The differences between submission methods creates a different level of documentation burden for your clinicians.
A measure steward is an organization that owns and maintains a measure. Pay attention to measure stewards because physicians may be more welcoming of quality measures stewarded by organizations they value. Able Health’s downloadable measure list identifies measure stewards for each MIPS quality measure (figure 14).
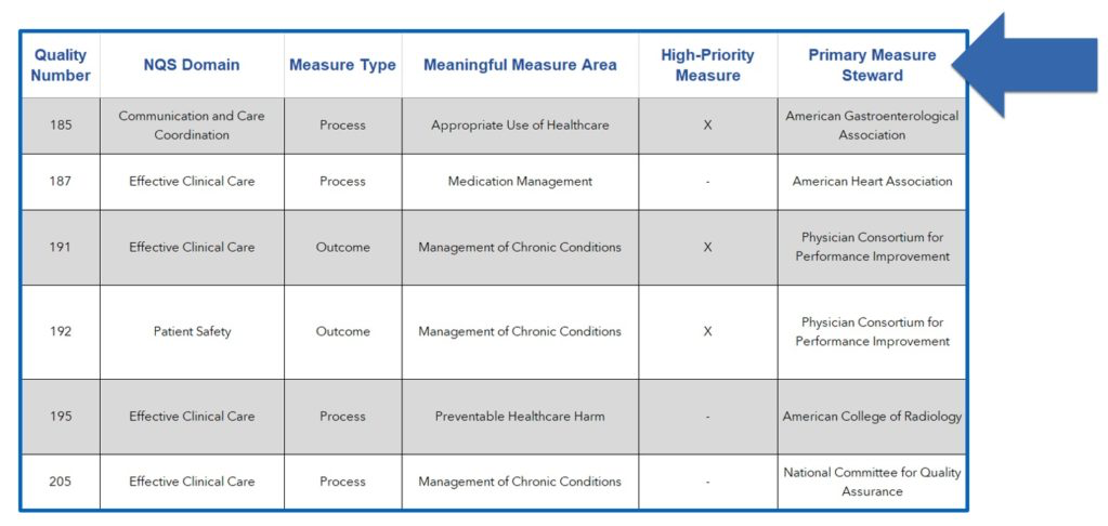
Measure stewards of MIPS quality measures are organizations like CMS, the National Committee for Quality Assurance, the National Quality Forum, and the American Heart Association. However, the list doesn’t stop there. Many medical associations your physicians belong to are also measure stewards.
Measure specifications detail the purpose of MIPS quality measures. That merit is described in two sections: Clinical Recommendation Statements and Rationale.
Here is an example from Quality #046: Medication Reconciliation Post-Discharge:
The research and statistics in these sections empower you to qualify and quantify clinical value. For example, let’s say 1,000 of your patients are discharged monthly from an inpatient setting. Let’s also say that 60 percent of those discharges were elderly patients. The study referenced in Quality #46 suggests that 432 of those 1,000 patients would be “taking incorrectly at least one medication started in the inpatient setting.” When choosing measures, qualify, quantify, and compare clinical value like this.
MIPS quality measures fall into seven different types. The type of measure matters for various big-picture reasons. First, outcome measures, including intermediate and patient-reported outcome measures, earn two bonus points. Second, process measures are more prone to be removed from MIPS in future years. Third, efficiency measures can help you perform better in the cost category and prepare for shared-savings and bundled-payment programs. Finally, some structure measures can be automated with technology.
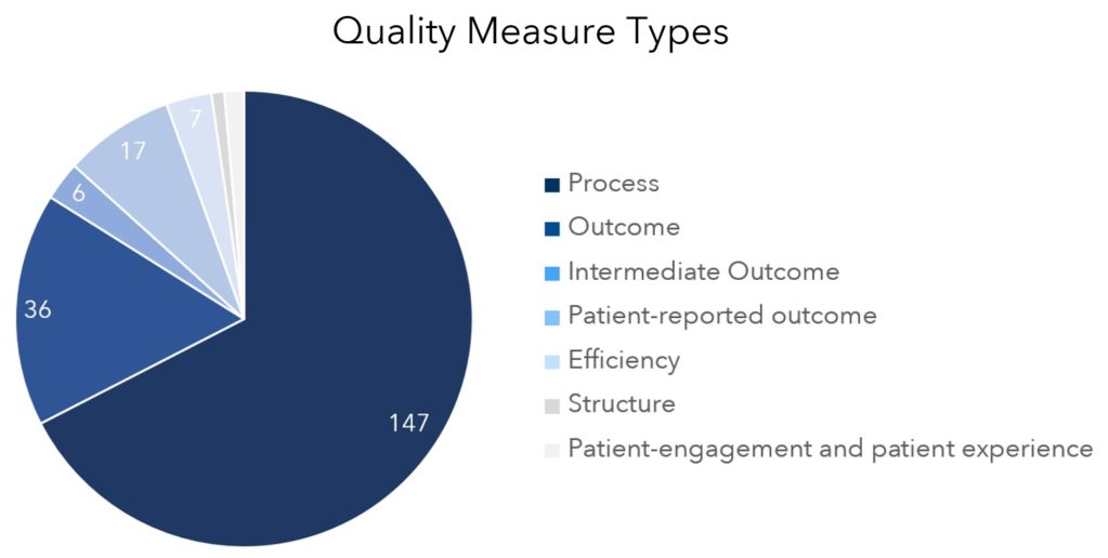
Here’s a definition and example for each type:
Make sure your list of MIPS quality measures is the very best selection for your team. You may want to replace one or more measures on your list using the measure-selection tips in this guide. And if you’re new to MIPS, follow these 12 FAQs sequentially in order to identify the best measures for your team.
Would you like to learn more about this topic? Here are some articles we suggest:
Would you like to use or share these concepts? Download the presentation highlighting the key main points.