Nearly half (46 percent) of all physicians report that they suffer from burnout, citing too many bureaucratic tasks as one reason. Providers want to find meaning in their work, and improvement on many current quality metrics do not predict better patient outcomes or experience of care. They are looking for tools to reduce their workload and improve their ability to provide excellent care, including having metrics and registries that are meaningful and informative.
Faced with the challenge of making quality measures meaningful, Mass General Brigham (formerly Partners HealthCare) worked to redefine measures to be more relevant, create point-of-care registries to manage an all-payer population, created teams of Population Health Coordinators to support front-line teams in managing the registries, and used its analytics platform to monitor change and explore provider variation in order to improve quality.
Physician burnout has been identified as an area of great concern for the future of healthcare as almost half of physicians are now reporting that they suffer from it.1 This concern has grown to the point where many are now calling to expand the often-quoted triple aim of healthcare—improving the patient experience of care, improving the health of populations, and reducing the per capita cost of health care—advocating for the addition of a fourth aim: improving the care and experience of the provider.2
In a recent survey, physicians reported that the top factors contributing to the stress that they experience include: too many bureaucratic tasks, spending too many hours at work, increased computerization of practice, feeling like just a cog in a wheel, and lack of professional fulfillment.3
Looking for meaning in their work, providers are discovering that many of the current quality metrics do not predict better patient outcomes or experience of care. They are searching for tools to decrease their workload and improve their ability to provide excellent care. This includes having meaningful information and registries, which are effective in improving patient outcomes.
Mass General Brigham is a large, non-profit healthcare system founded by Brigham and Women’s Hospital and Massachusetts General Hospital, and includes community and specialty hospitals, a managed care organization, a physician network with over 6,500 physicians, community health centers, and home care. Mass General Brigham determined that it was time to improve the care and experience of its providers by helping them find meaning and insight from the quality metrics they were being asked to collect.
Mass General Brigham struggled with the challenge of timely collection and reporting of the increasing number of registry, publicly reported, and payer metrics. The organization recognized that its current approach to quality metrics did not help answer the following simple questions as they relate to quality measurements from a Regional Service Organization (RSO), practice or provider perspective:
Without answers to these questions, providers could not clearly see how to improve care for their patients, nor could they see how to improve their own performance, even when their compensation was tied to these metrics. The current process of quality metrics reporting posed three barriers to effectively leveraging quality metrics to produce better patient outcomes and clinician satisfaction:
Clinicians have historically had to wait days or weeks to effectively assess performance and communicate it appropriately to managers and frontline providers. Mass General Brigham recognized the need to integrate quality data in a way that puts real-time, or near real-time, quality insights at clinicians’ fingertips. These insights must be actionable, clinically meaningful, and easily accessible to drive improved clinician support. Mass General Brigham was determined to develop a new approach to quality metrics that would relieve, not add to, clinicians’ administrative burden while being truly effective in improving patient care and outcomes.
Mass General Brigham embarked on a transformation to a new set of quality measures that would truly measure how well doctors are providing care to their patients, and how they can improve care in the future. Key to this approach was to block out the noise—such as patient criteria that are beyond the control of the provider—to focus on actionable information. To identify the noise to avoid, and the quality measures that were needed, stakeholders were engaged early in the process to ensure that the correct data points were addressed, as well as to facilitate ultimate clinician support.
Mass General Brigham’s approach to building and deploying a new, superior set of quality measures started with a critique of current measures. Many of the clinical quality measures being used suffered from deficiencies that created confusion with the data and did not create a clear roadmap for clinicians who wanted to improve care. The shortfalls included imprecise inclusion and exclusion criteria. For instance, many of the quality measures did not take into account patient comorbidities, may not have properly excluded patients who had died or moved to a different primary care provider, or the measure may have been limited to only CMS patients.
Using the concept of registries to define patient populations, the metrics were modified and applied so that they were more clinically meaningful for a specific subset of patients. Numerators and denominators were clearly defined and applied through automated applications so that the data output was accurate and consistent. This allowed Mass General Brigham to move one step further along the path to realizing the value of useful clinical outcome measurement (see Figure 1).
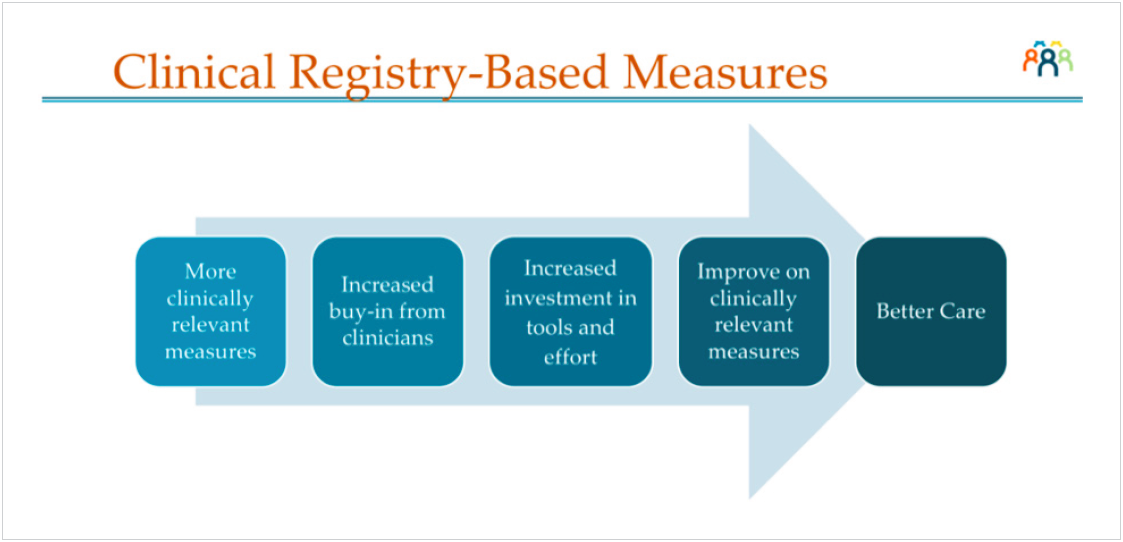
Developing a new set of meaningful metrics addressed the provider’s concerns that they were not measuring the correct data points—or not measuring them accurately. To further improve the provider experience, Mass General Brigham needed to address their major dissatisfiers by decreasing the time spent on bureaucratic tasks, making workflows more efficient, and leveraging automation to provide insight and decrease the burden of reporting. To accomplish this, Mass General Brigham integrated data from multiple diverse systems in a meaningful way to Figure 1. The value proposition of useful clinical outcomes measurement achieve information-at-the-fingertips, relieve duplicate data entry, and make reports readily available.
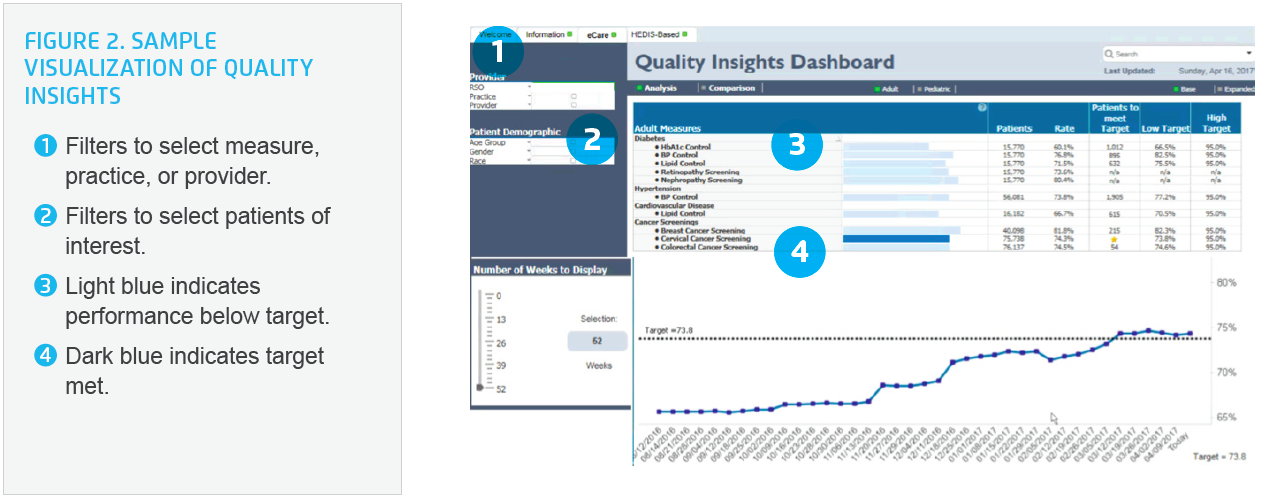
Once the barrier to data availability was overcome, the new metrics and registries were automated and made accessible through the combined use of the EHR and the Health Catalyst® Analytics Platform, including the Late-Binding™ Data Warehouse. The Quality Insights applicaton (see Figure 2) allows for near real-time reporting so RSOs, healthcare practices, and providers can obtain answers to their questions about performance and what can be improved, and use that information to enhance the quality of care delivered to their patients.
Offering visibility to changes in trends and individual performance gives an early warning to clinicians so that they can change and improve care protocols as soon as best practices are identified or unwarranted variation or potential harm is discovered.
High-quality, accurate, and real-time data is required to engage stakeholders, highlight variation, use as a compass to target improvement activities, and incorporate longitudinally as a test of change. When providers have no confidence in the data, they will not use the information to drive practice decisions. The provider’s previous experience with quality metrics had not yielded significantly better patient outcomes or experience of care. As a result, many providers viewed quality reporting as an inefficient use of their time that did not help their patients.
The denominators of many of the original quality measures were flawed in definition, and difficult to report consistently, adding to physician’s level of dissatisfaction and limiting their utility. By failing to identify the right patients for inclusion and exclusion, the measures could not accurately represent physician performance, nor could they be used to identify opportunities for improvement. For example, patients included in the hypertension measure were determined by those patients who were billed for hypertension in the first six months. By that standard, it included patients screened in ED that did not really have hypertension. This undermined clinician trust in the data.
Using registries, based on the criteria from the new clinically meaningful metrics within the EHR and Quality Insights, gave a consistent underlying data structure with inclusion rules that reinforced the criteria to establish the denominator, making the data more reliable. By automating additional registries to identify a specific subpopulation of patients, the metrics became even more meaningful.
Overcoming previous negative experiences with quality metrics was necessary to obtain clinician support, trust, and use of the analytics application. Mass General Brigham conducted training webinars on accessing, navigating, and uses for the application. Once the clinicians were able to see the information for their own patients and RSOs, their confidence in the data grew.
Quality Insights allows them to view metrics for their performance management system that uses registries in the EHR, as well as the national standard measures which pull from claims data. Metrics are updated weekly, addressing the timeliness issue, and show a rolling 12-month data point and trend line, which provides insight into performance.
The combined approach of making quality measures meaningful, easing the administrative burden of producing them, and improving end-users ability to track them has gained significant physician support. The results include the following:
“In trying to respond to quality reporting requirements, we often end up measuring what we have data for, not those things that are most important.”
- Neil Wagle, MD, MBA, Associate Chief Quality Officer, Center for Population Health
It is estimated that many hundreds of productive hours of provider time will be saved per month when the application is fully utilized, due to near real-time measurement, and delivery of run charts and comparison data. This is a vast improvement over the customary two-week wait for these quality reports. Mass General Brigham plans to further increase adoption of the use of Quality Insights across the system.
They also plan to add patient experience and specialty quality metrics to the platform in the coming year. As users become more proficient with the application, they expect to see the information drive quality improvement, sharing of best practices, and enhanced metric performance.