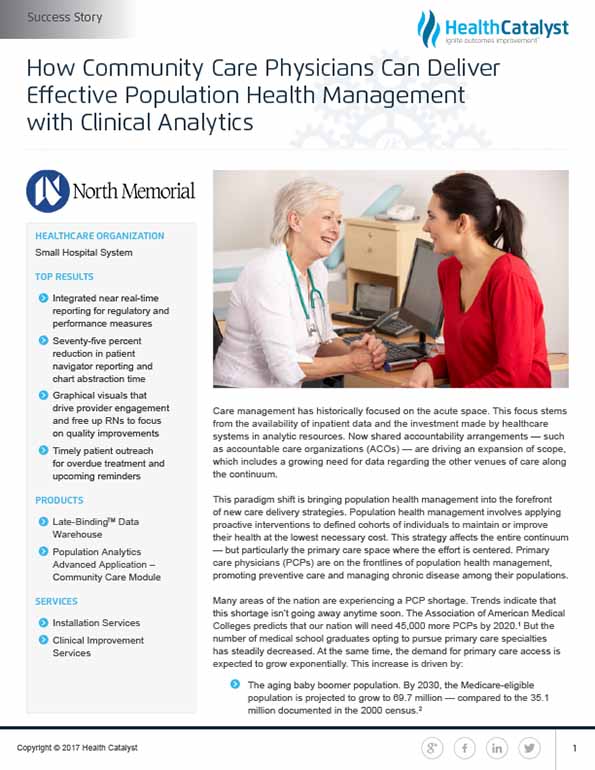
Care management has historically focused on the acute space. This focus stems from the availability of inpatient data and the investment made by healthcare systems in analytic resources. Now shared accountability arrangements — such as accountable care organizations (ACOs) — are driving an expansion of scope, which includes a growing need for data regarding the other venues of care along the continuum.
This paradigm shift is bringing population health management into the forefront of new care delivery strategies. Population health management involves applying proactive interventions to defined cohorts of individuals to maintain or improve their health at the lowest necessary cost. This strategy affects the entire continuum— but particularly the primary care space where the effort is centered. Primary care physicians (PCPs) are on the frontlines of population health management, promoting preventive care and managing chronic disease among their populations.
Many areas of the nation are experiencing a PCP shortage. Trends indicate that this shortage isn’t going away anytime soon. The Association of American Medical Colleges predicts that our nation will need 100,000 more PCPs by 2030.1 But the number of medical school graduates opting to pursue primary care specialties has steadily decreased. At the same time, the demand for primary care access is expected to grow exponentially. This increase is driven by:
North Memorial Health Care — a 518-bed two-hospital system in the Minneapolis- St. Paul metro area — was determined to establish an infrastructure that would enable its clinics and providers to manage the health of its patient populations more effectively. This population health initiative covers 13 clinics and more than 85 providers — including physicians, physician assistants and nurse practitioners — who see an estimated 950 patients per day. As participants in a Medicaid ACO and future participants in a Medicare ACO, these clinics needed the ability to manage the health of targeted populations. Specifically, they set a goal not only to promote preventive care, but also to identify and engage patients with multiple chronic diseases to help them achieve optimal care and reduce unnecessary utilization of the emergency department and other more expensive care venues.
North Memorial knew that moving to population health management would require significant analytics capabilities — particularly the ability to aggregate, analyze and report on data. Without an analytics platform in place to handle this heavy lifting, valuable clinic staff was spending a great deal of time piecing together reports from the available data. This process left little to no time for analysis and took staff away from more important work. The two roles most affected by this manual process were registered nurse (RN) care coordinators and the patient navigator:
Another challenge the clinics faced was monitoring requirements for the Minnesota Statewide Quality Reporting and Measurement initiative. Effective January 1, 2010, all physician clinics in Minnesota were required to submit data on measures— called Minnesota Community Measures (MNCM) — to be publicly reported to the Commissioner of Health. Measurements include diabetes care, ischemic vascular disease care, depression remission, asthma care, colorectal cancer screening, primary C-section rate and more.
The clinics needed a way to look at performance for their entire patient population and also for those specified by the State of Minnesota. They needed a way to easily filter and view data for the MNCM measures. Additionally, North Memorial wanted the ability to compare clinics and providers by specialty in order to identify best practices and areas for improvement.
North Memorial had already deployed a healthcare enterprise data warehouse (EDW) from Health Catalyst. This EDW aggregates data from the EMR, financial systems, patient satisfaction systems and more to create an enterprise-wide, consistent view of all of the hospital’s data — a single source of truth to inform business decisions. North Memorial had used the EDW with great success in the Women and Newborn’s department, driving a significant reduction in its rate of unnecessary pre-term deliveries.
Based on that success, the hospital determined to apply the EDW and the lessons it had learned about quality improvement to other care processes — including population health management across the care continuum. To solve its population health management problems, North Memorial implemented Health Catalyst’s Population Analytics Advanced Application – Community Care Modules on top of the EDW foundation.
Though establishing the EDW and the Community Care modules was the engine behind this new quality-improvement effort, Health Catalyst and North Memorial knew that sustained process and quality improvement would not be possible without more profound cultural and organizational change. Therefore, they established a community care clinic multidisciplinary team approach. This permanent, integrated team approach consists of
Working together to optimize the role of each participant on the team — and to integrate insight from the analytics solution into the workflow — the team has experienced significant success in a very short time.
As shown in Figure 1 below, the team now has access to near real-time reporting for more than 20 regulatory and performance measures. These measures include preventative measurements, such as screenings and immunizations, and disease management. The solution’s scalable architecture makes adding additional measures easy and will enable the team to respond proactively to future measures as they are proposed by CMS.
The team cites the following as the most beneficial aspects of the solution:

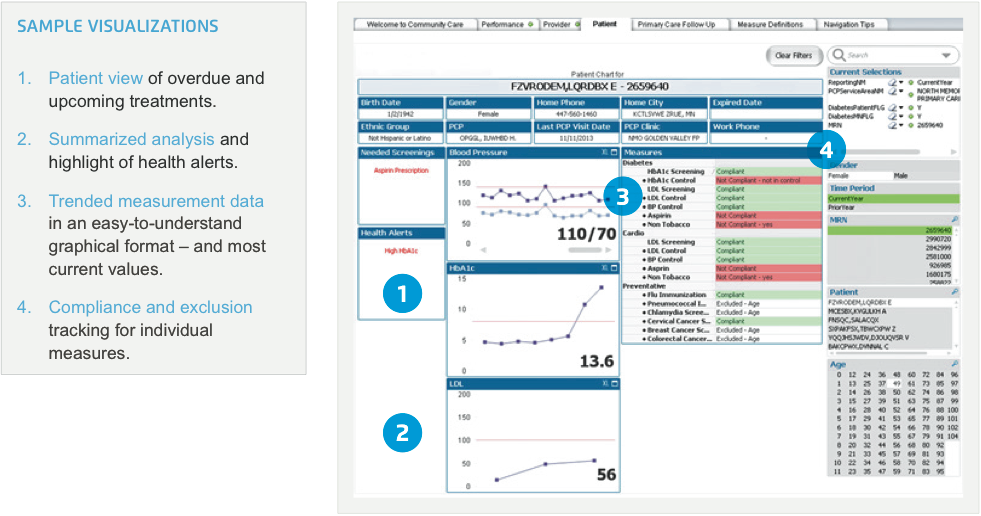
The patient navigator estimates that the Community Care analytics module enables her to perform reporting and chart reviews 75 percent faster. She is able to identify patients for care coordinator outreach more rapidly. Furthermore, individual care coordinators are now able to evaluate their success more accurately at both an aggregate and individual level. Figure 2 illustrates the individual patient view now available to the team. Features of this view help the team monitor the patient’s health status and compliance with evidence-based measures.
RN patient care coordinators assert that the solution saves them an estimated 25-30 percent of their time per clinic. With the solution’s self-serve analytics and graphical visualizations, these RNs spend less time creating reports. At the same time, they can easily communicate progress and results to the clinics’ providers and management. This enables them to focus instead on clinical workflow and quality improvement.
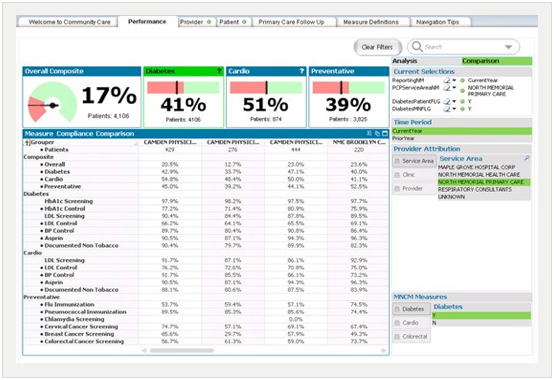
At the same time, with performance information at their fingertips, the clinics’ providers are more engaged in driving improved results—one of the main goals the RNs were attempting to achieve with their manual reports. Figure 3 below is a sample visualization of quality performance across the different clinics and providers, now available to the entire team. This information is used by clinicians to identify best practices as well as opportunities for improvement.
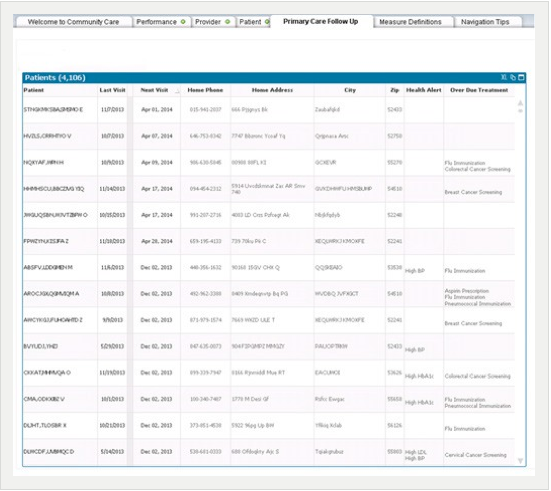
The analytics application and visualizations deliver a summarized community follow-up view. This view can include patients with health alerts, overdue treatments and upcoming reminders — enabling the staff to generate near real- time lists of patients who aren’t compliant with recommended, evidence-based care guidelines. This ensures that providers reach out to patients in a timely manner. Not only does this ensure appropriate follow-up and health management, but it also helps facilitate patient engagement — helping them participate more proactively in managing their care.
“Much of the data we had in the past [from the EMR] was information required for reporting rather than what we needed for change management or real process improvement. It didn’t give us insight about how to improve care across our populations. Now we have access to the kind of information that we need to drive our plans for improving our workflow and managing our populations.”
– Grace Saba, RN, Patient Care Coordinator
With the Community Care analytics module newly rolled out, North Memorial has made significant productivity strides in a short amount of time. Plans for the near future include:
Perhaps the organization’s most impactful near-term effort will be expanding the role of the RN patient care coordinators. With their time freed up from manual reporting and with robust data at their fingertips, these RNs will focus on analyzing workflow across the clinics to identify the best opportunities for quality improvement. These RNs, working closely with data from the EDW, will play a key role in moving their clinics up the successive levels of the Healthcare Analytics Adoption Model (HAAM). This model, designed to help healthcare organizations assess their adoption of clinical analytics technology and processes, outlines how an organization can first establish a foundation for automated internal and external reporting and then progress to measurable, sustainable clinical quality improvement.