Promoting exclusive breast milk feeding for infants has become increasingly important. Studies show that breastfeeding benefits the health of both babies and mothers. From a population health perspective, breastfeeding is associated with decreased risk for many early-life diseases and conditions, including otitis media, respiratory tract infections, asthma, atopic dermatitis, gastroenteritis, type 2 diabetes, sudden infant death syndrome and obesity.
At the same time, women who breastfeed have demonstrated a decreased risk for type 2 diabetes, ovarian cancer and breast cancer.1 Because of these benefits, national and international public health organizations recommend that women feed their infants exclusively breast milk for at least the first six months of life.2
However, the rates of breastfeeding are lamentably low in the United States. The percentage of babies exclusively breastfed at three months old is approximately 38 percent and this rate drops to 16 percent by six months.3
To improve population health, public health organizations are aiming to change this statistic. Specifically, these experts are targeting hospitals to promote exclusive breastfeeding—and to ensure that babies only receive supplemental formula in the hospital as a last resort. This focus on exclusivity in hospitals is driven by several factors. Studies have shown that:
Public health organizations have developed several programs and measures to promote exclusive breast milk feeding. The most influential of these include:
To meet standards for the various regulatory and public health initiatives noted above, this healthcare system needed to measure a number of items, including:
When they kicked off their initiative, the team had only baseline data for the first of these measures—and the data had been hard to come by. In one hospital within the system, compiling the baseline required two nurses to spend approximately seven hours each month manually auditing charts and interpreting the data.
To supplement this effort, the hospital also contracted with third- party chart abstractors. Due to limited nursing resources and costs for these third party contractors, the hospital was constrained to measuring the data based on small sample rates.
Another challenge the healthcare system team faced was the limitations of their EMR system in performing the necessary analytics. Data was difficult to extract from the EMR and combine with other data sources. The team tried using the EMR analytics platform to extract TJC metrics; however they were unable to acquire the needed reports. Furthermore, the data they needed was housed in multiple locations within the nursing documentation, preventing users from recording important data.
The team needed an alternate solution that would eliminate manual analytics work, a different documentation paradigm, and the ability to reliably scale, track and report on its improvement efforts.
The Women and Newborn service line established a cross-functional team at one of the hospitals. This team included physicians, a nurse leader, a knowledge manager, a nursing subject matter export, EMR analysts, and data architects. These individuals were the ones principally involved in interacting with the data, setting goals, determining which best practices to implement, and more.
Including representation from each of these groups ensured that all perspectives were accounted for throughout planning and implementation of the project. The team worked together to understand each group’s needs up front, exchange unique insights and align on measurement and reporting.
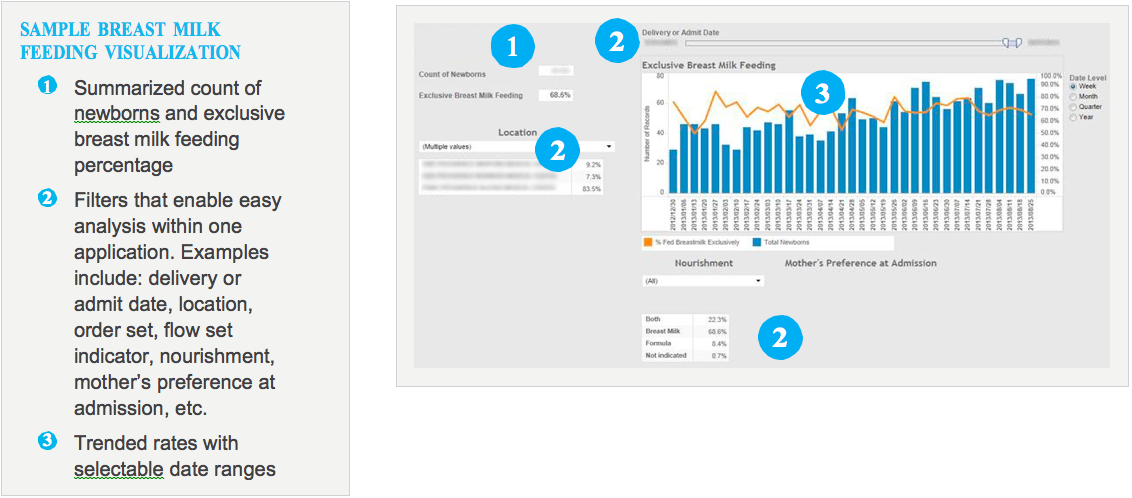
The team leveraged their Health Catalyst healthcare enterprise data warehouse (EDW) as the foundation for driving its improvement initiative. On top of the EDW, they implemented a newborn advanced analytics application that would enable them to establish baselines, track performance metrics and distribute information to everyone involved in the initiative. The newborn analytics application features dashboards and visualizations that enabled users to quickly and easily interpret and analyze the data.
They also developed and implemented a plan that allowed for accurate documentation and monitoring of newborn nutrition practices. This was done by establishing a design team with system-wide representation from all of hospitals.
Leveraging the EDW, the team successfully defined and created a newborn registry, which was then published to users throughout the system through an executive dashboard that displayed robust visualizations. The shared dashboard and visualizations enabled system-wide coordination and kept everyone on the same page.
The team found that rather than just producing a reportable metric, the application enabled them to analyze data and gain the additional insight they needed to interpret the metrics accurately.
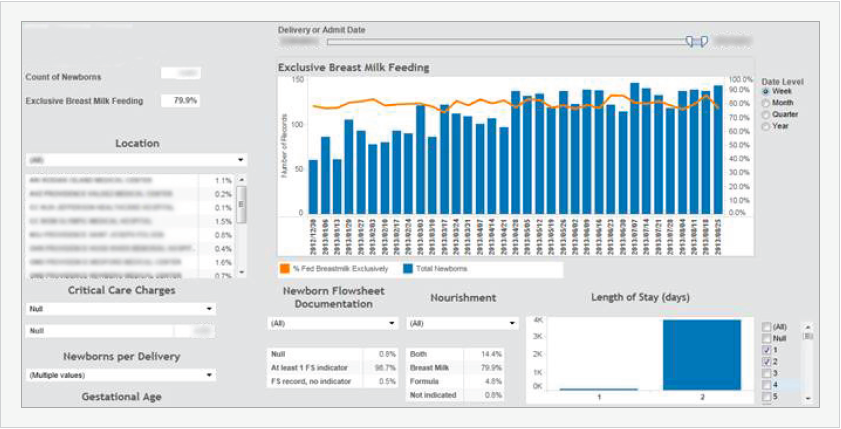
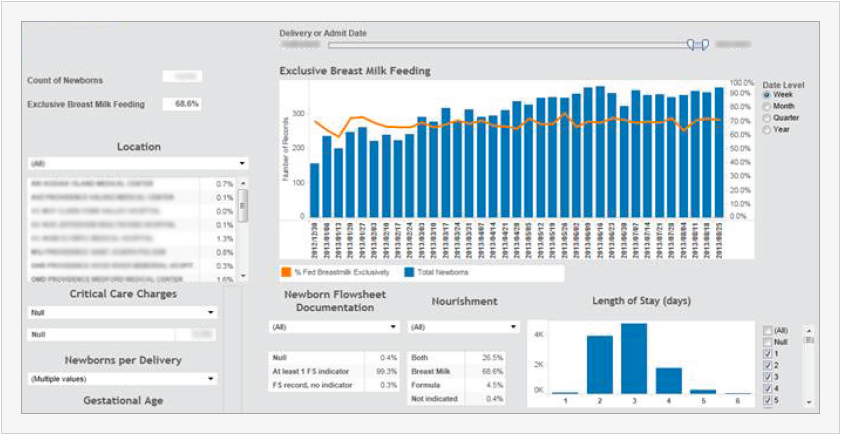
Just looking at the metric, one might conclude that LOS drives whether or not a mother breastfeeds. However, because the team was able to drill down further into the data using the application, they could see that the deliveries with longer LOS typically involved either surgery (e.g., a C-section) or a newborn complication that interfered with exclusive breast milk feeding. This kind of self- service analysis helped the team target its improvement efforts more accurately and effectively.
Using the advanced analytics application, the health system successfully developed three dashboards that enabled it to promote compliance with best practices and track its performance on key regulatory metrics:
Manual chart abstractions to establish baseline metrics required two nurses spending an average of seven hours per month. That equates to almost 60 hours of lost productivity each month across each hospital in the system. Multiplying this figure across the health system means the total loss of productivity among the nursing staff is quite significant.
Because of limited staffing and the inability to commit additional nursing resources to chart abstraction, the healthcare system had contracted with third-party organizations. One hospital in the system calculated that it took the contracted entities a month to abstract an estimated 2 percent of the records at a cost of $10,000. Furthermore, with the nurses and the third-party abstractors working together, the healthcare system was still only able to establish baselines based on a sample of data.
“The population health advanced analytics application has given us an extremely helpful way to look at our data. It delivers a visual presentation that everyone can grasp immediately. No matter what hospital in the system you’re a part of, you can look at the visualizations and understand exactly what’s going on.”
– MD, Neonatologist, Medical Director, NICU
A significant hurdle was overcoming data capture and workflow gaps. As the team began to analyze data, it discovered that much of the information they needed was missing or incomplete. Part of the problem was that the information could be charted in multiple EMR locations (for example, in either the newborn’s or the mother’s chart). In addition, many clinicians were charting feedings in the form of text notes rather than in the EMR’s structured data field. Because nurses had to chart feedings every 2-3 hours for each newborn, the team needed to establish an easy, consistent, structured way for the nurses to capture the data.
The healthcare system addressed this challenge by working with their EMR vendor. A rapid cycle process was utilized holding design team meetings over a few weeks. Approval was elicited and obtained from appropriate clinical governance bodies. An education training plan was formulated and system-wide implementation is now in process.
For the population of normal newborns (regardless of mother’s nursing preference), the breast milk feeding rate has increased from 69.3 percent to 83.9 percent—a 21 percent increase. For the population of normal newborns (including only mothers who specified they would exclusively breastfeed), the breastmilk feeding rate has increased from 80.2 percent to 90.6 percent—a 13 percent increase—for the same period.
The clinical improvement analytics platform will enable the team to develop new dashboards to track compliance with improvement interventions and the impact of each intervention on the breast milk feeding rate.