Cesarean deliveries have become one of the most common surgical procedures performed in the United States each year.1 Between 1998 and 2008, the rate of cesarean delivery in the United States rose by 50 percent—from 22-33 percent of all births. This steep trend is principally attributed to an increase in first-birth cesareans.
Many healthcare stakeholders have turned their attention to reducing this rate for clinical, financial and regulatory reasons:
Because it is difficult to delineate which C-section rates account for valid high-risk deliveries, regulatory requirements are focusing on measuring and reducing the cesarean rate for deliveries assumed to be low risk. Such low-risk deliveries—called NTSV C-sections—involve nulliparous women with a term, singleton baby in a vertex position (first-time term mothers with a single baby that is appropriately positioned head-down).
Beginning in 2014, hospitals accredited by The Joint Commission are required to publicly report their NTSV rates. The National Quality Forum is also promoting voluntary standards for perinatal care that include this metric. Many healthcare organizations are finding that this reporting is difficult to perform because of poor data quality and manual reporting processes.
A healthcare system we worked with was quick to understand the need to track the NTSV metric. This healthcare system’s Women & Children’s division has undertaken an initiative to drive higher-quality, lower-cost obstetrical care by measuring and reducing unnecessary NTSV cesarean deliveries.
The healthcare system is committed redesigning patient care, developing and deploying leading evidence-based care practices across its system, improving data quality and using their data to make decisions to positively impact healthcare delivery. As a key component of this effort, they partnered with Health Catalyst, an analytics and data warehousing company to implement a proven analytics framework for value-based transformation.
One of the first steps toward establishing this framework was implementation of an electronic medical record (EMR). However, business intelligence leaders quickly realized that the EMR alone was insufficient for the level of analytics they required. Data was difficult to extract from the EMR and combine with other data sources.
Collaborating with Health Catalyst, the business intelligence team created a healthcare enterprise data warehouse (EDW) that overcame these problems. The EDW enables an enterprise-wide, consistent view of data combined from the EMR and financial, patient satisfaction and other systems. The EDW also eliminates the manual data-gathering process for reporting and automates data distribution.
With combined clinical and financial data on hand in the EDW, the business intelligence and clinical teams were able to identify the care improvement opportunities that would have the greatest impact on cost and quality. An analytics application—Health Catalyst’s Key Process Analysis (KPA)—analyzed EDW data to pinpoint variability in care and areas of high resource consumption throughout the organization, as shown in Figure 1.
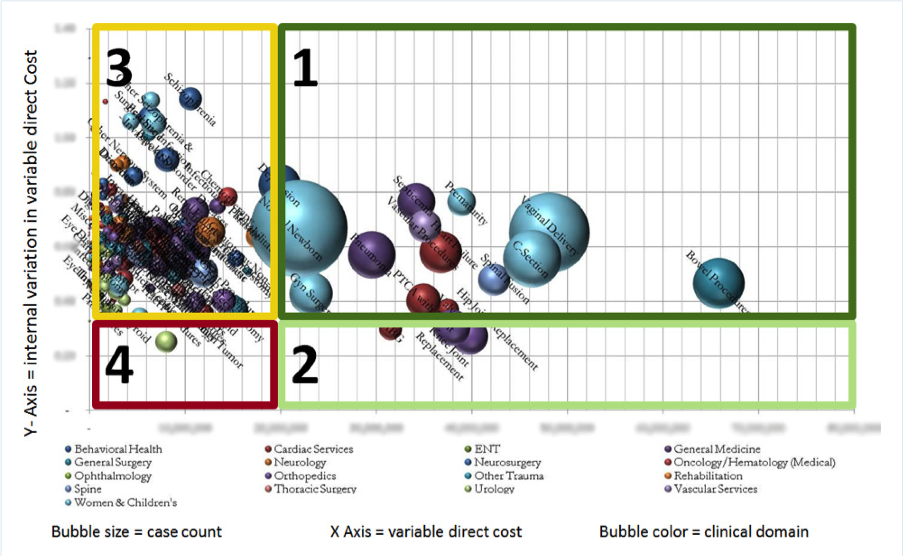
Successfully improving clinical outcomes also requires a strong organizational commitment and may necessitate changes in culture, organizational structure, staff education and workflow processes. Consequently, the healthcare system also assessed the Women and Children’s Services readiness for change. They looked at criteria such as the clinical leadership readiness, data availability, shared vision and available resources. Combining their readiness assessment and KPA results (e.g., case count, length of stay, variation in care and variable direct cost,)—Women and Children’s Services rose to the top as a high-opportunity clinical program.
“I was thrilled with the way the Key Process Analysis application used our data to show us where to focus our quality improvement efforts. I’ve been doing analytics and reporting work for a long time, and the decision of where to focus is often based on factors other than concrete evidence. It’s so important to know that we’re working on areas where we can have the biggest impact on cost and quality.”
– Women and Children’s Program Director
The Women and Children’s team was already using data to help drive care improvement. The department had maintained a homegrown clinical registry. The registry—which predates any EMR in the healthcare system—contains high-level, clinical data about the Women and Children’s population. The team had experienced real success using the registry to establish a process for reducing its pre-term elective delivery rate.
Though proud of its accomplishments with the registry, the Women and Children’s team recognized the need to scale its analytics effort. Maintaining its registry was a time-consuming process because the data had to be extracted manually from patient charts. Not only did the process consume valuable nursing resources, but it also failed to yield timely data. It could take as long as three months to get needed data into the registry.
The EDW and its automated processes was the solution the team needed to scale its efforts and branch out from its success of lowering the elective C-section delivery rate. Knowing that national focus would soon be shifting to the NTSV cesarean rate, the team decided to kick off its EDW-driven improvement initiative by measuring this rate.
Because the healthcare system had never attempted to measure its NTSV rate in the past, the team had to start from scratch. The first step was creating a women and children’s population health registry. A foundational Health Catalyst application called the Cohort Finder helped the team create this registry. The application analyzed data in the EDW to identify deliveries that met the following criteria:
Using diagnostic codes and supplementary clinical data, the application helped the team define and refine the NTSV patient population.
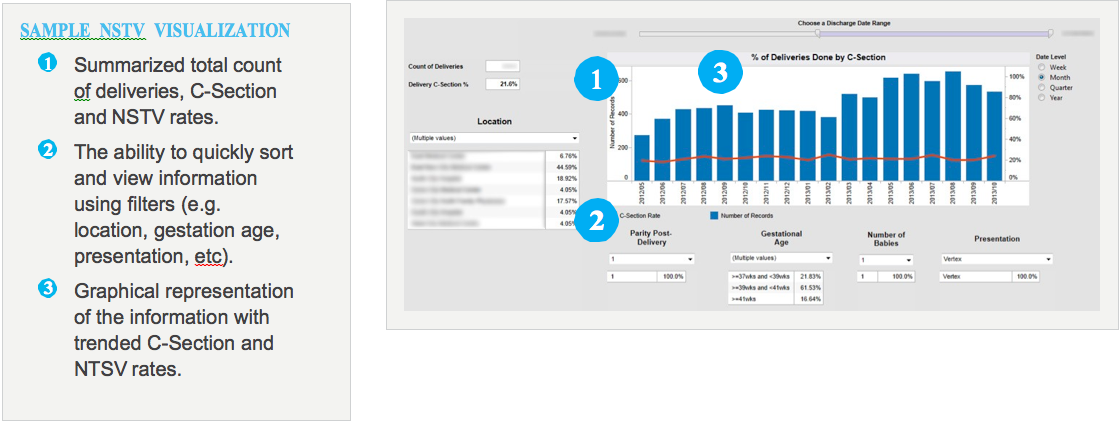
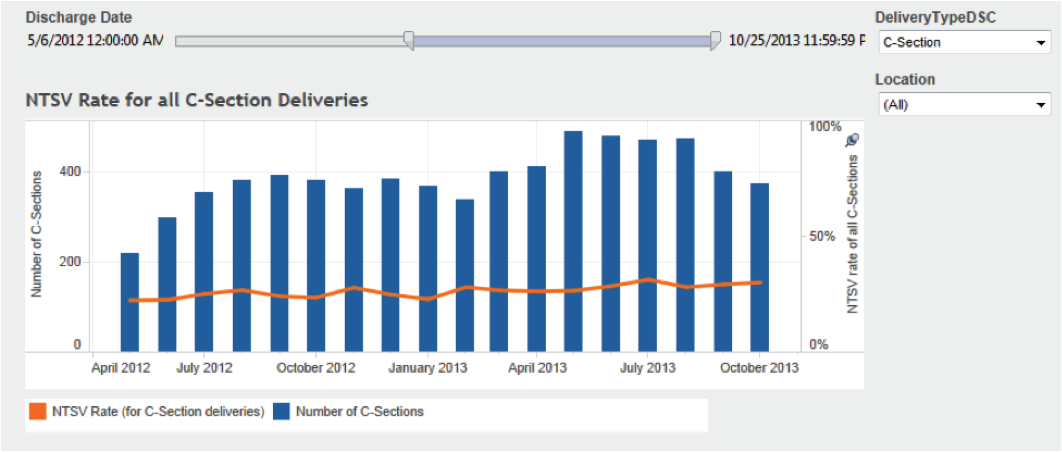
The team also installed an analytics application—the NTSV Cesarean module—to run on the EDW platform. The module enables the team to measure baseline care processes and outcomes, create visualizations specific to NTSV metrics and measure the effectiveness and outcome of care improvement interventions.
As data from the EDW began to flow into the NTSV data mart, the multi-disciplinary workgroup team began to notice gaps in the data that indicated problems with its EMR data capture processes—a common discovery in many analytics projects. Some data was missing; other data was inconsistent. The team encountered several data quality issues, including:
Because these documentation gaps affected the ability to measure outcomes, they became an important focus of the workgroup team. This commitment to analyzing data issues has given the team the opportunity to work with clinicians and the EMR optimization team to better align documentation to clinician workflows and to teach the importance of accurate and meaningful records.
As a result, the healthcare system has made strides in improving their documentation. For example, by creating a report that nurse managers can run to see how many charts don’t have the “marked as delivered” field checked and subsequently educating staff, the team has improved capture of this important data point.
Before embarking on this project, Women and Children’s had no data available on their NTSV rate, which meant they weren’t able to report it when asked in requests for proposals (RFPs) submitted by payers or by large employers. The team didn’t have any healthcare system benchmark data to work with, nor were any national benchmarks available.
Now, the health organization is able to establish an NTSV baseline that can be rolled out across the system. Not only will this data help them to win RFP awards based on reporting accuracy and quality improvement, but it will also make it possible for the Women and Children’s team to report their NTSV rates to regulatory bodies such as The Joint Commission.
Establishing this system for measuring NTSV rates and automating external reporting enables the healthcare system to meet level four of the Healthcare Analytics Adoption Model. Women and Children’s is now focused on measurable quality improvement and better managing the health of its population.