Hospital-acquired infections are a significant patient safety concern for healthcare organizations. In the U.S., an estimated 223,900 hospitalized patients develop Clostridioides difficile (C. diff) infection, a bacterial infection associated with antibiotic treatment that can cause life-threatening diarrhea, resulting in 12,800 deaths annually.1
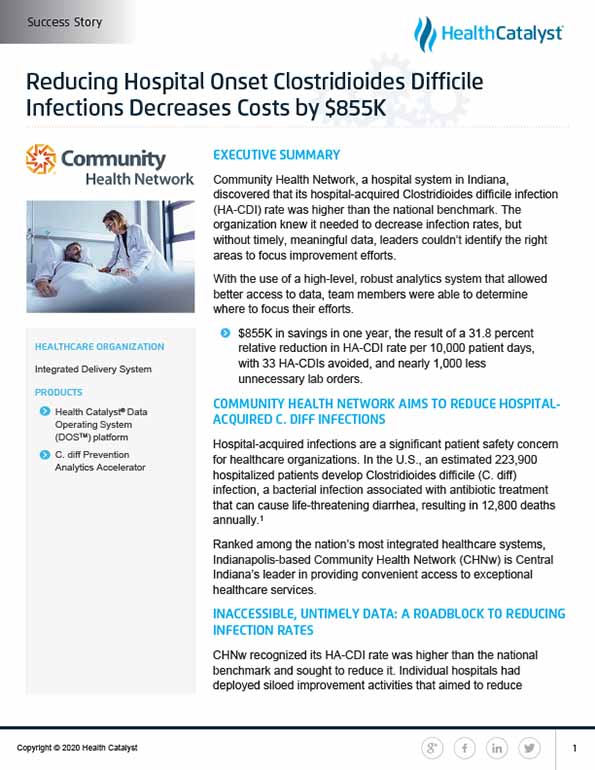
Ranked among the nation’s most integrated healthcare systems, Indianapolis-based Community Health Network (CHNw) is Central Indiana’s leader in providing convenient access to exceptional healthcare services.
CHNw recognized its HA-CDI rate was higher than the national benchmark and sought to reduce it. Individual hospitals had deployed siloed improvement activities that aimed to reduce HA-CDI. Without cohesive standard processes that addressed the root cause, those efforts were largely ineffective.
CHNw knew it needed to improve, but the organization lacked access to timely, meaningful data that would allow it to fully explore performance and identify opportunities for improvement.
While the data the organization needed for improvement was available in the EMR, it was incredibly difficult to access. Furthermore, meaningful data could only be obtained through time-consuming manual processes at an individual hospital level, impeding the ability to understand network-wide performance. Without an efficient mechanism for drilling down to root causes, CHNw could not implement impactful solutions to mitigate HA-CDIs.
CHNw needed a comprehensive, data-driven approach to reduce HA-CDI rates, decrease costs, and improve patient safety.
CHNw uses a consistent, systematic improvement methodology to drive and accelerate improvement efforts. The health system convened an interdisciplinary network improvement team to apply its improvement methodology to decrease HA-CDI.
The improvement team leveraged the Health Catalyst® Data Operating System (DOS™) platform and a robust suite of analytics applications, including the C. diff Analytics Accelerator, to understand organizational performance and drill into root causes.
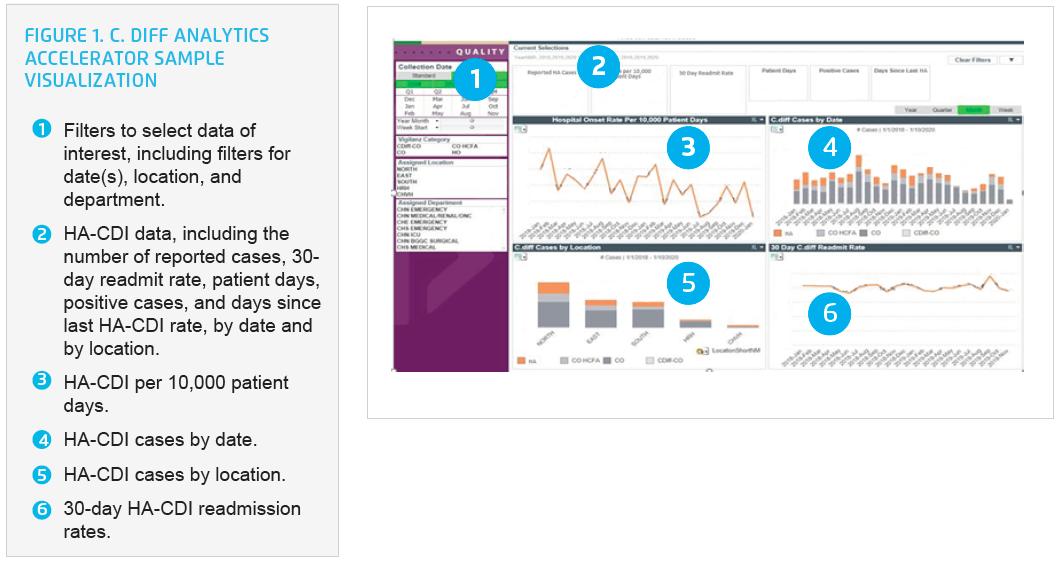
Using the C. diff Analytics Accelerator, CHNw was able to quickly and easily visualize C. diff performance data, including HA-CDI rate per 10,000 patient days, the reported number of HA-CDI cases, the number of positive cases, and days since the last HA-CDI (see Figure 1).
CHNw used the analytics accelerator to drill into detailed unit and patient-level detail, identifying three common opportunities that drove the improvement strategy:
CHNw further leveraged the analytics accelerator, defining deviations from standard organizational processes, and visualizing deviation data in the analytics accelerator. CHNw was able to quickly identify the following:
The discrete data, including the patient-level detail required to effectively review the deviation from standard practice, are visualized in the analytics accelerator, enabling rapid review of deviations, eliminating the burdensome manual chart review process, and expediting follow-up with individual clinicians to discuss and understand the reasons for the deviation (see Figure 2).

CHNw uses the deviation data to identify patterns and trends and the root causes associated with those trends, enabling continuous improvement.
Using this comprehensive data-driven methodology, CHNw substantially reduced HA-CDI rates, improving patient safety and quality while also reducing the cost of care, in one year:
“The C. diff Analytics Accelerator enabled us to make a huge impact on our patient’s lives, to improve quality, and to reduce our costs by more than $850K. We’re applying our learning to similar patient safety events, improving safety and financial performance across our network.”
– Patrick McGill, MD, EVP, Chief Analytics Officer
With the standard workflows in place for early identification and isolation of patients with CDI symptoms upon admission, CHNw plans to further enhance its antibiotic stewardship strategies across the network and will expand its work into the ambulatory care areas to further reduce CDI rates. The organization is also investigating its cleaning product practices to prevent cross-contamination in areas with high rates of patient turnover, such as the imaging and emergency departments.