Built from the same data, risk-adjusted for patient complexity before anyone sees it. Finance can defend it. Doctors can't dismiss it.
Up to 4.2:1 Year 1 ROI on a single service line. Real client results below.
Why now
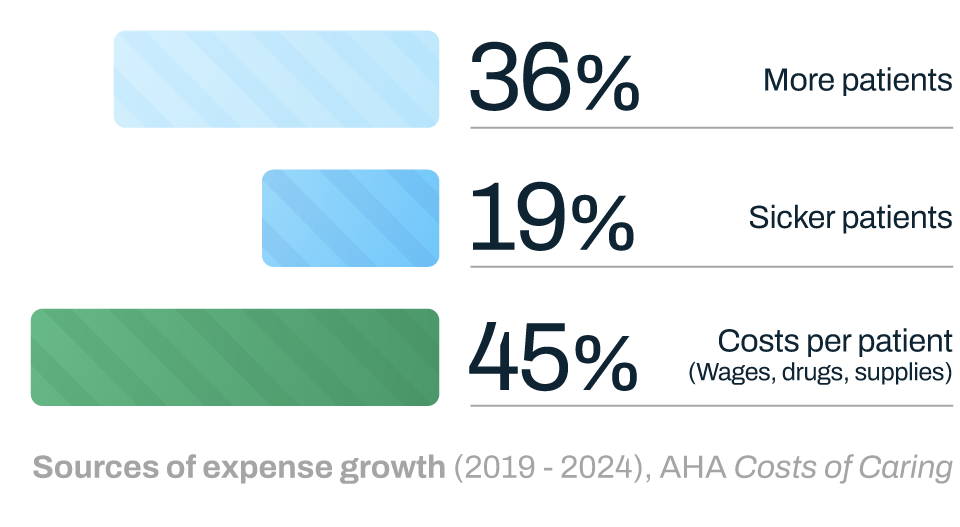
It's structural. Expenses have been outpacing price growth for years, and the workforce and supplies costs behind it haven't reversed.
The data to fix it already exists. It's just never been trusted by both sides of the table at once.
See what that same number looks like in your data
We can show you, using your own cost data, not an industry benchmark. First findings in 45 days.
From your seat
It's that finance and clinical leadership have never been looking at the same number. Here's how that closes, seat by seat.

The problem
The board wants a plan. What shows up is a report, already stale.

The payoff
Enterprise-level visibility into where the money is, backed by data that holds up in the room.

The problem
What finance can defend on paper isn't what survives a room full of surgeons.
The payoff
The same data, risk-adjusted before anyone sees it. Finance can stand behind it. Clinical leadership can't wave it off.

The problem
Every question about cost by procedure or physician becomes a two-week wait on an already-backed-up analyst.
The payoff
The same data, self-service, explored without waiting on anyone.

The problem
Finance trusts the methodology. Physicians don't, because it was never adjusted for how sick their patients actually were.
The payoff
The same finding, risk-adjusted, case by case. Not a benchmark to argue with, their own data.
What it does

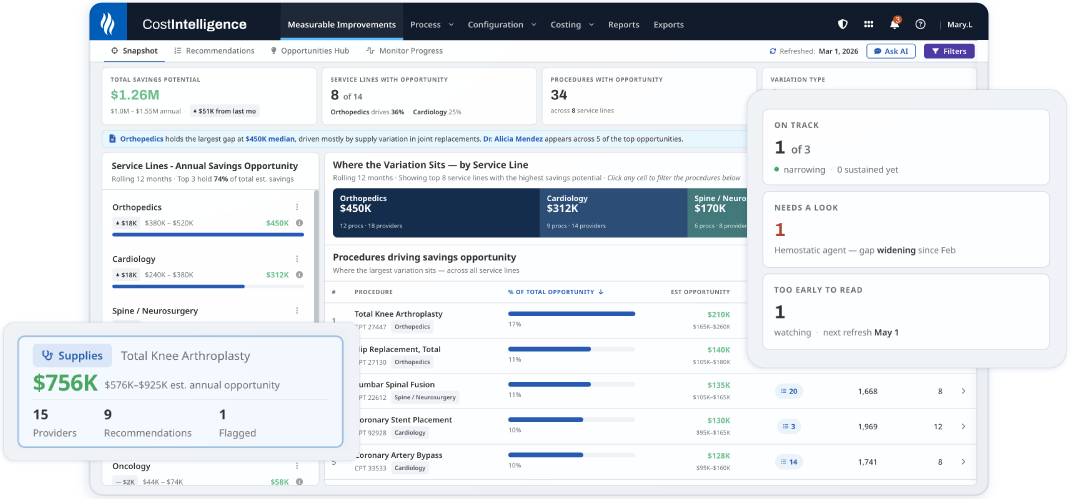
Where the gap surfaces first: a physician above peer cost, risk-adjusted, side by side with a peer.
Dashboard highlights
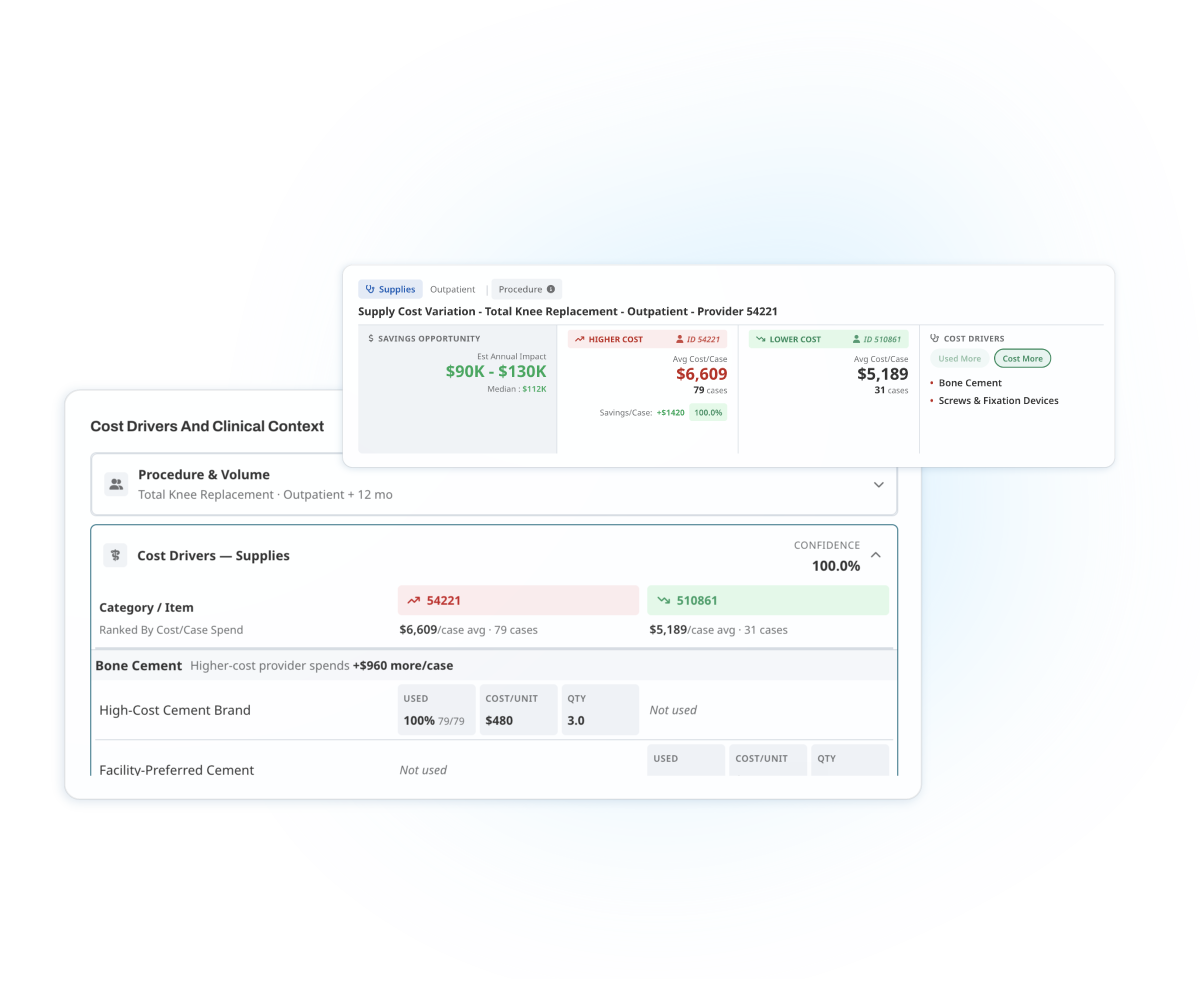

Every physician on a procedure, ranked by cost per case.
Dashboard highlights

The system-wide view, refreshed after every GL close.
Dashboard highlights
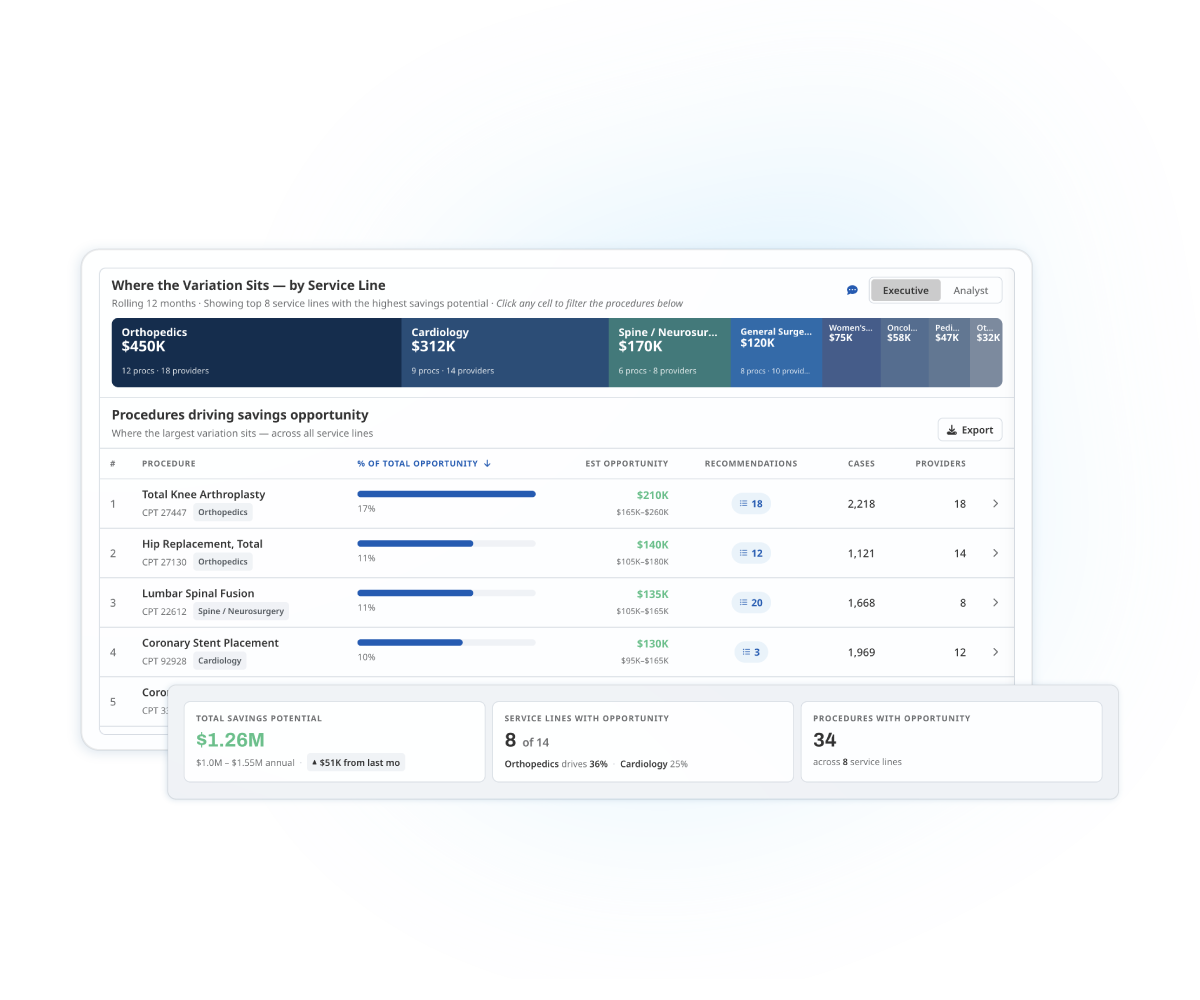
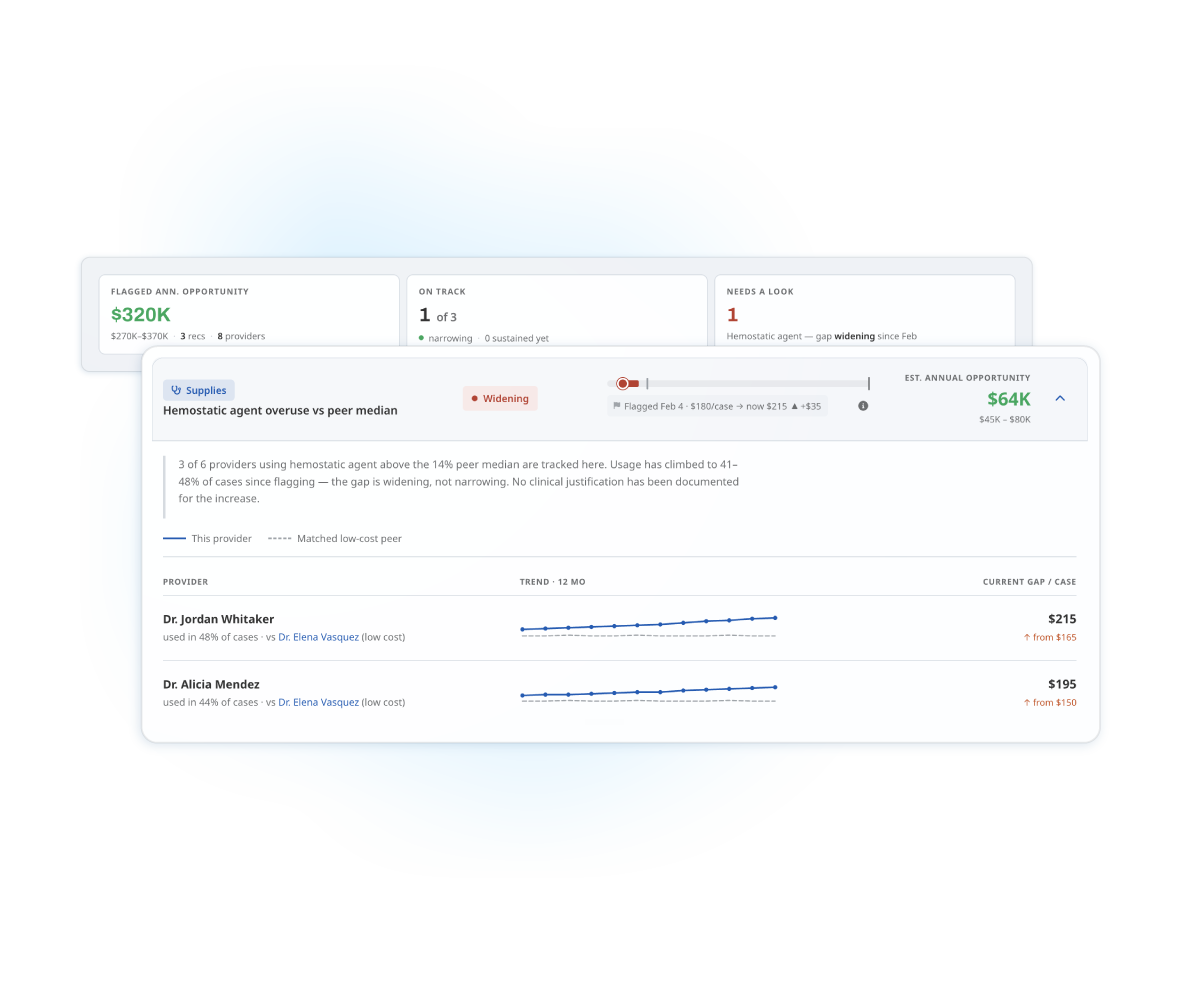

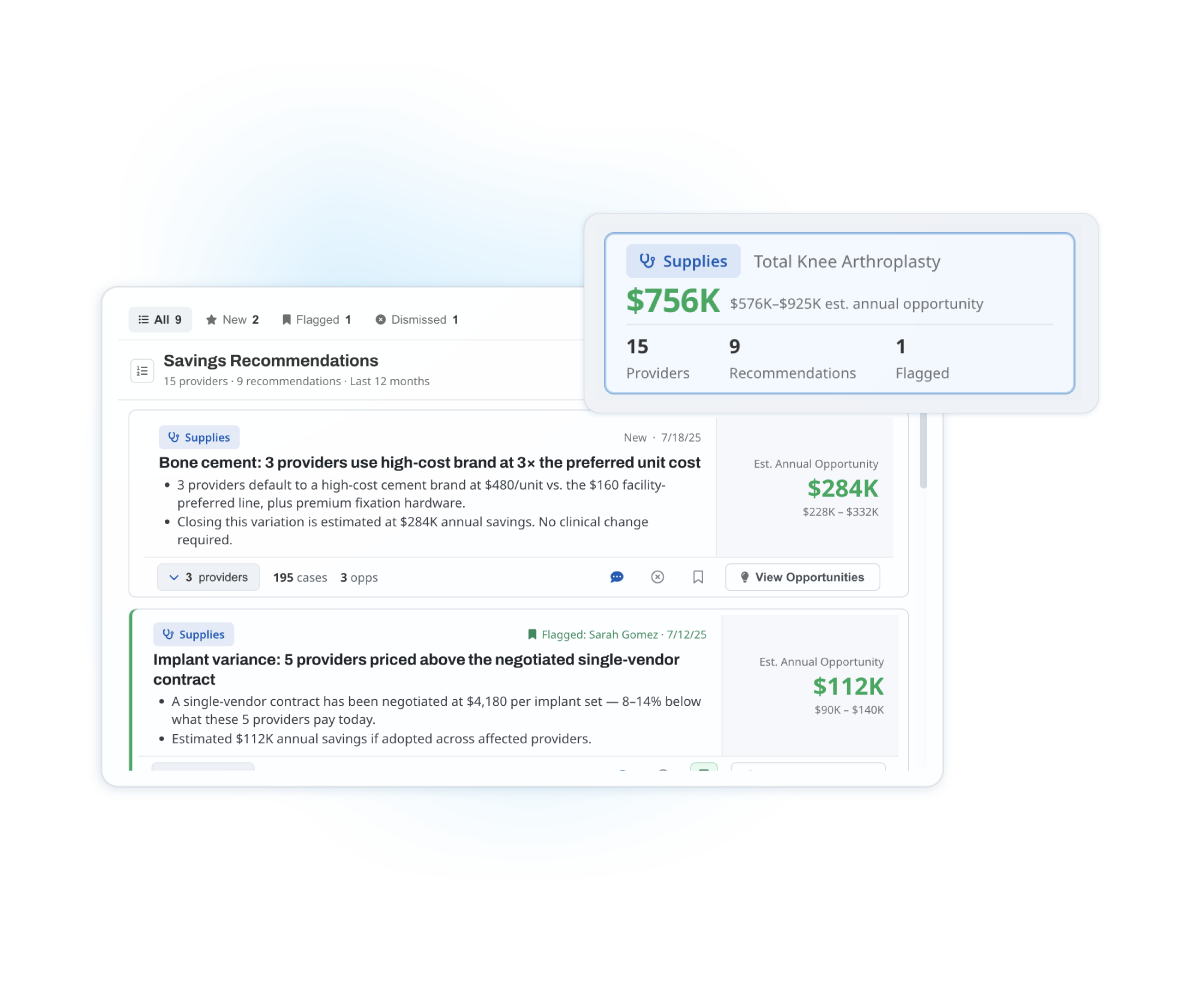
Where a finding becomes a tracked initiative.
Dashboard highlights
Natural Language Query
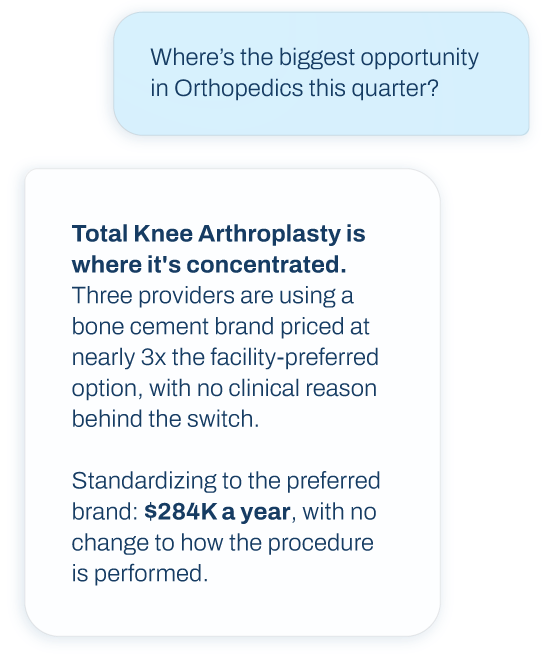
Ask it a plain question, "where's the biggest opportunity in Orthopedics this quarter", and get a real answer back. No dashboard to dig through, no analyst, no query to write.
It's built on the same data foundation behind every recommendation on this page, so the answer isn't a guess dressed up in confident language. It's something you can actually act on.
Large, Non-Profit Regional Health System
$4.3M
in savings in year one
Across engagements
$5.7M
in identified savings on average
How we work with you
Before go-live, your team gets ready: a sponsor clears the way, an operational lead owns adoption, IT connects the data.After that, we stay in it together: interpreting findings, keeping leadership focused on what matters most, and turning progress into the next move.

Cost Intelligence pairs a GL-defensible cost model with an AI engine that finds the opportunity, and the people who help you close it. We'll model your first year's opportunity against your own data and service line mix, before you've committed to anything.