Somewhere in your system right now, a patient is waiting three weeks for a provider who has open slots this Thursday. Nobody's hiding that. Nobody can see it either. Multiply that gap across your network — the growth you're working toward is likely hiding in the capacity you already own.
$25.4M in new outpatient care revenue, without adding capacity. Read the case study
Why now
Medical cost trend has been elevated for five straight years, reimbursement hasn't kept pace, and a new outpatient clinic runs $1.25–2.85M before it sees a single patient. The old growth play — build more — no longer adds up.
The capacity you need already exists. It's just unscheduled, or sitting in a spreadsheet nobody's opened since Tuesday.
A consultant walked into one health system last year, looked at how they were tracking ambulatory performance—a wall of Excel tabs—and told them flatly: “you could save real money just by not doing this in spreadsheets anymore.”
What’s this worth to your system?
Find out using your own scheduling and revenue data, not an industry average.
From your seat
The impact starts with a patient who left, or a referral that didn't come back. Each team names it differently and solves for its own piece. But what’s possible once you see the full picture?

The problem
Growth targets slip and nobody can say why. Revenue, referrals, and access all get reported by different teams.

The payoff
The financial impact of every access constraint in board-ready terms: where margin is leaking and where growth is available without adding headcount.

The problem
Physicians carry unsustainable panels and the usual fix, just see more patients, erodes trust fast.
The payoff
Productivity tied to panel health and the referral revenue it drives, so the conversation with a physician is supported by data.

The problem
A referral leaves the network because nobody could show, in the moment, that capacity existed in-house.
The payoff
The clinic-level opportunity — ranked by what's recoverable this quarter — so every leader is working the same list, in the same order.

The problem
Aggregate reports treat a balanced panel and an overloaded one the same.
The payoff
Panel balance and workload, benchmarked against peers in your own system.
What it does
Clinical, scheduling, and billing data live in systems that were never designed to talk to each other. Ambulatory Intelligence connects them into one operational picture — intelligent enough for the boardroom, but precise enough for the front line.

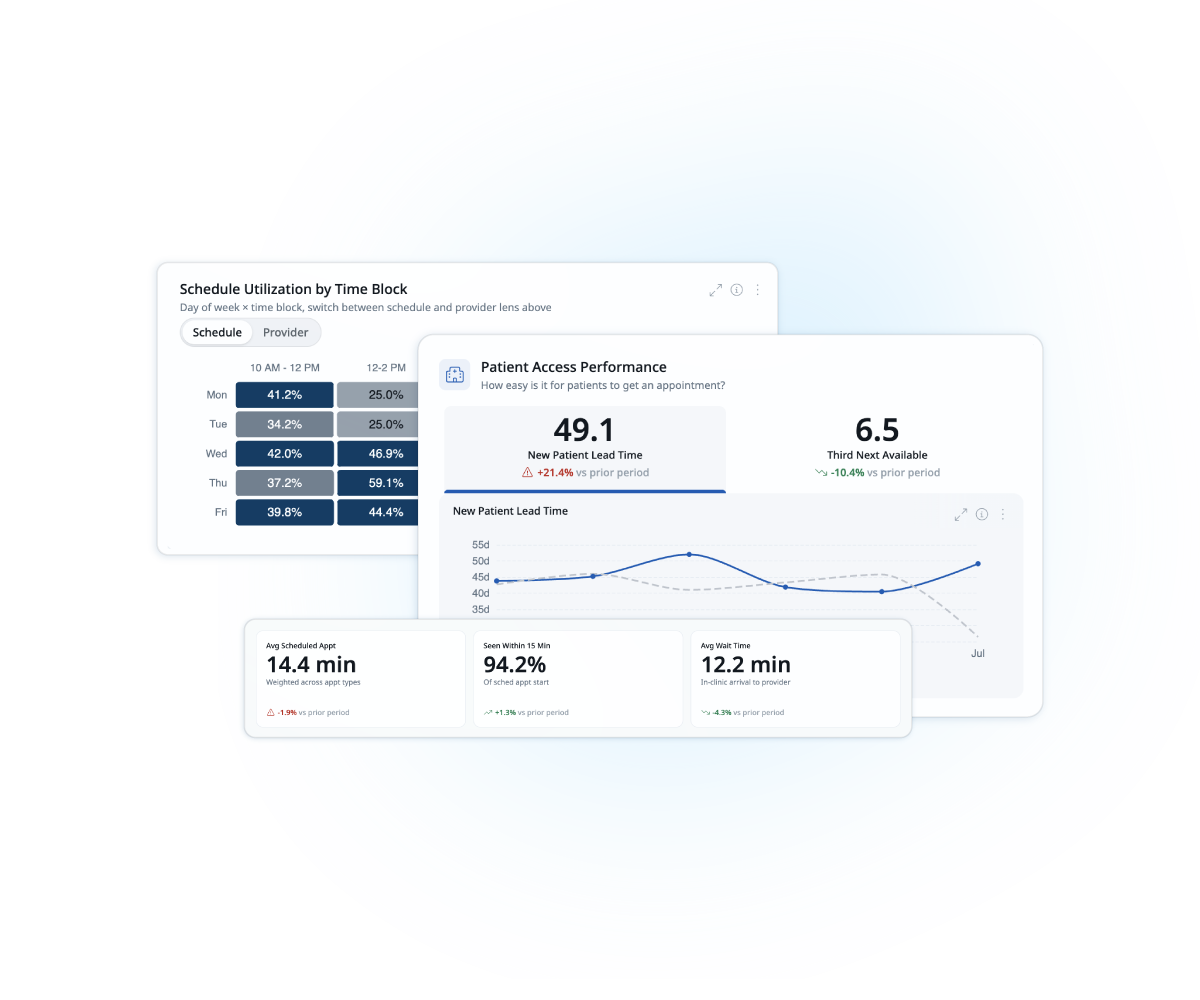
A clinic with a three-week wait and unfilled slots looks fine in most reporting tools. Here, it shows up as a number — the patients the gap cost you last quarter, the downstream visits that left with them, and the schedule change that closes it — in time to recover the capacity before next week's schedule is set.
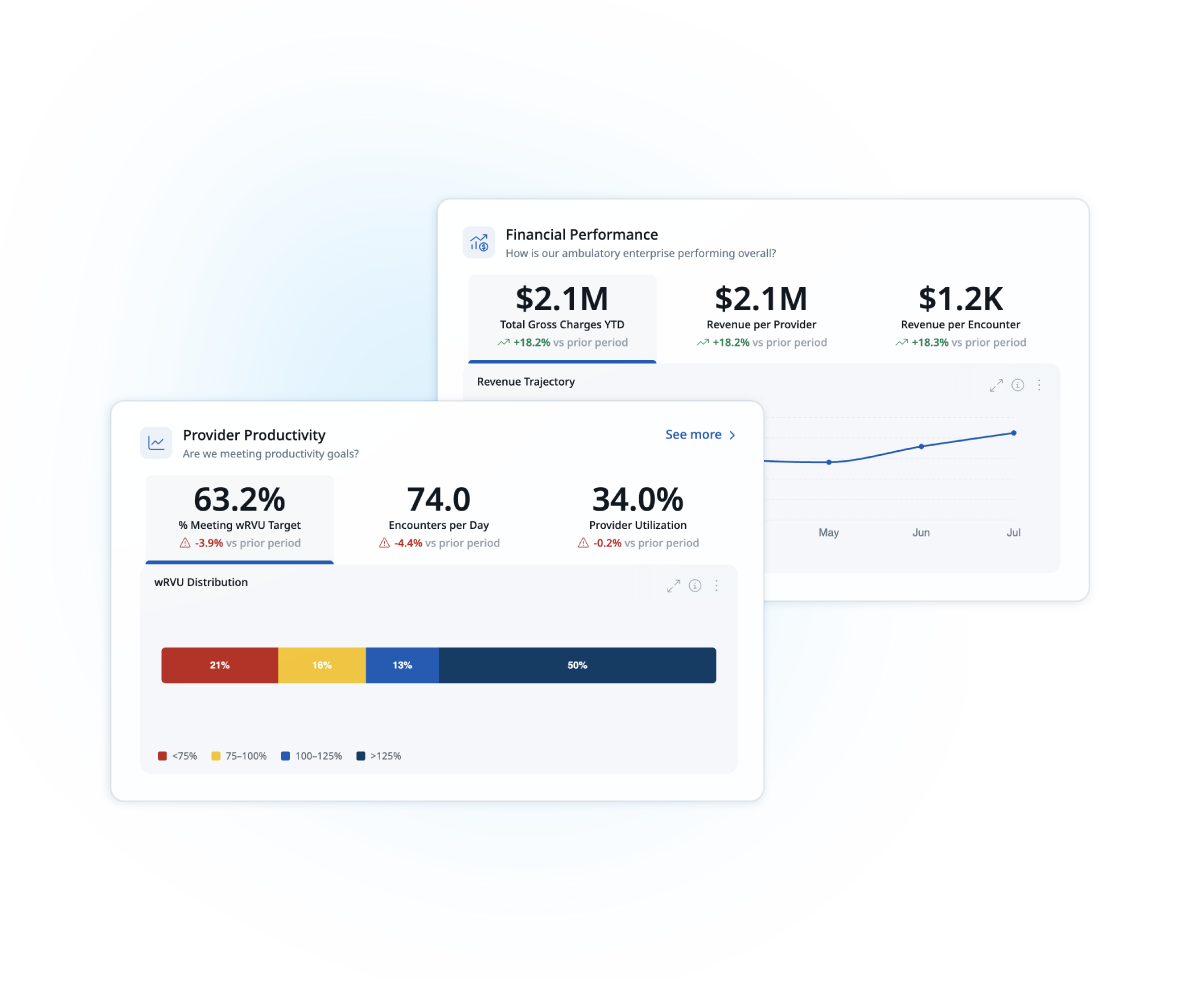

Connects what each provider does to what it earns. Variation in productivity, coding, and revenue per encounter stops hiding inside averages. From there, identify which patterns to spread, which to fix, and what each one is worth.

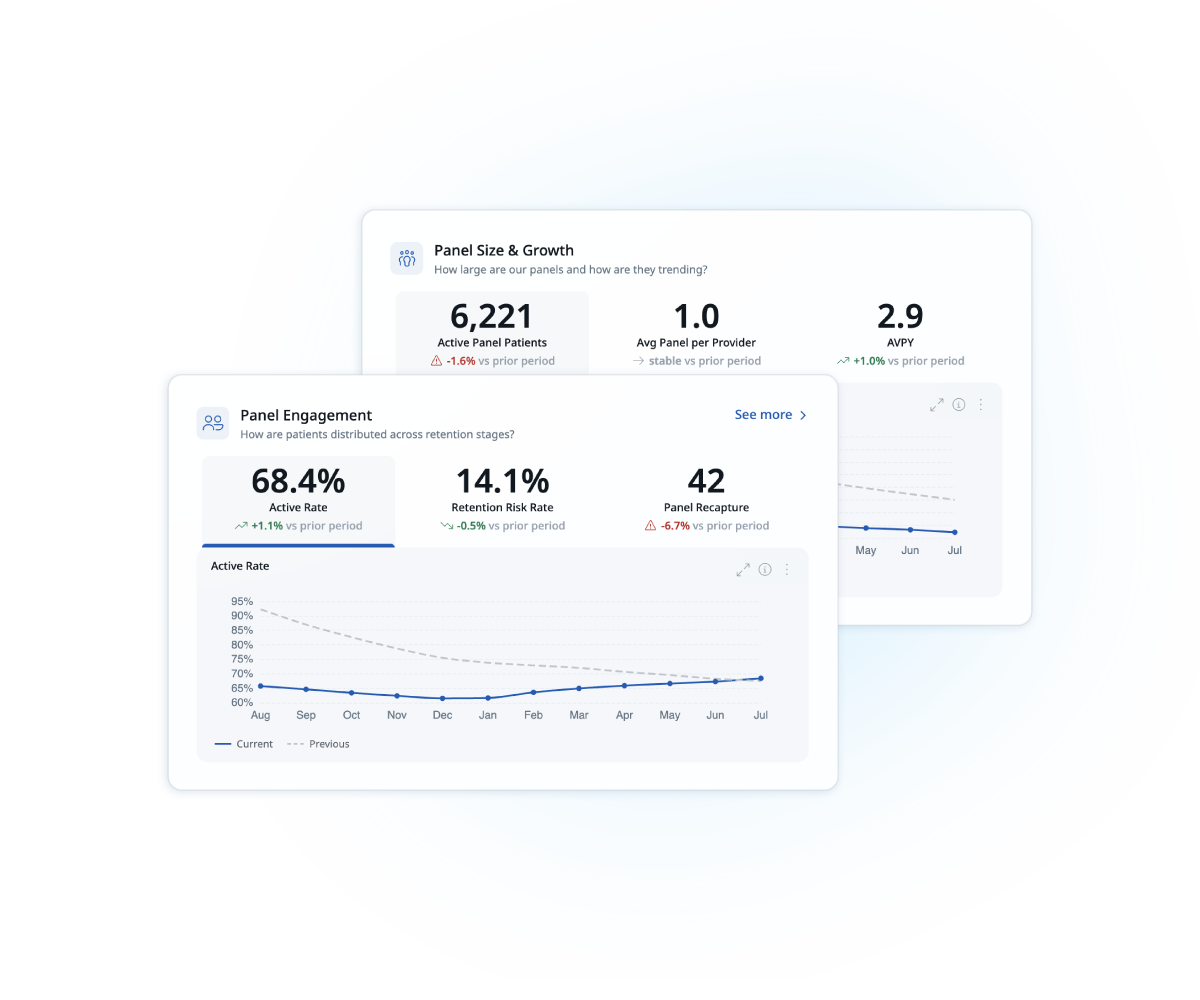
Panels get rebalanced against real demand before burnout becomes the signal. Care gaps surface the way a provider already thinks about them: a preventive standard a patient hasn't yet met, flagged in the chart today, while there's still time to act on it.
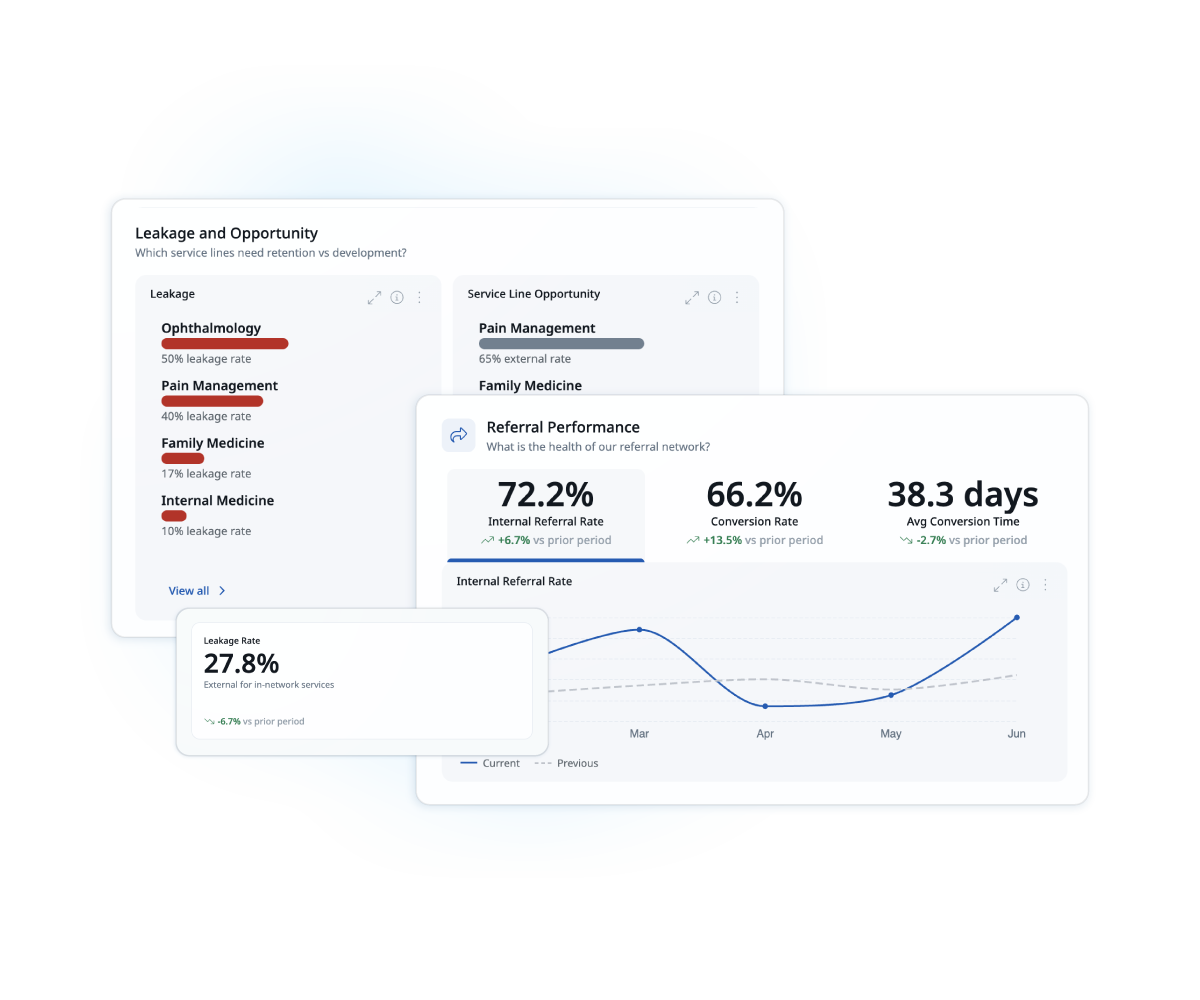

A referral that leaves your network used to be invisible volume. Here, it's a visible route out the door including what's driving it, what it's worth, and the point where it could have stayed in-house.

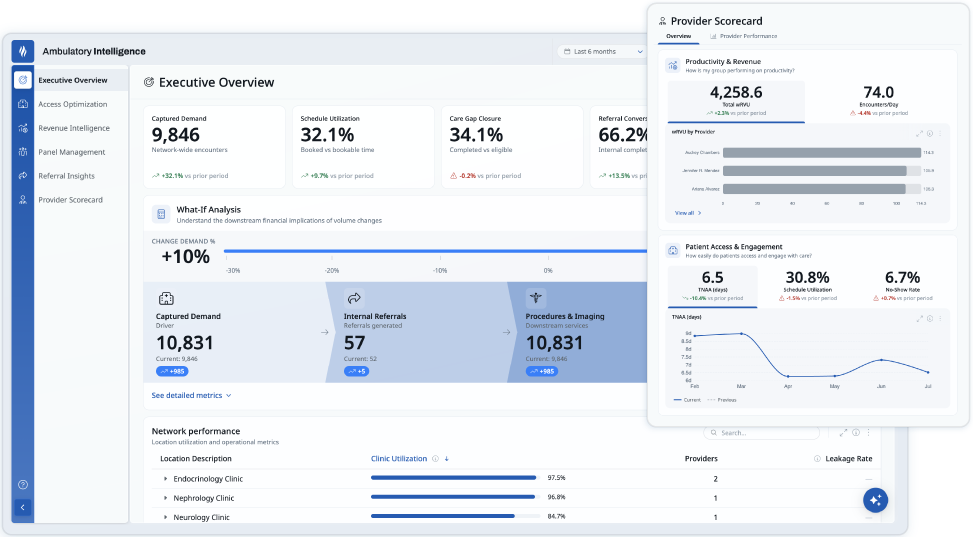
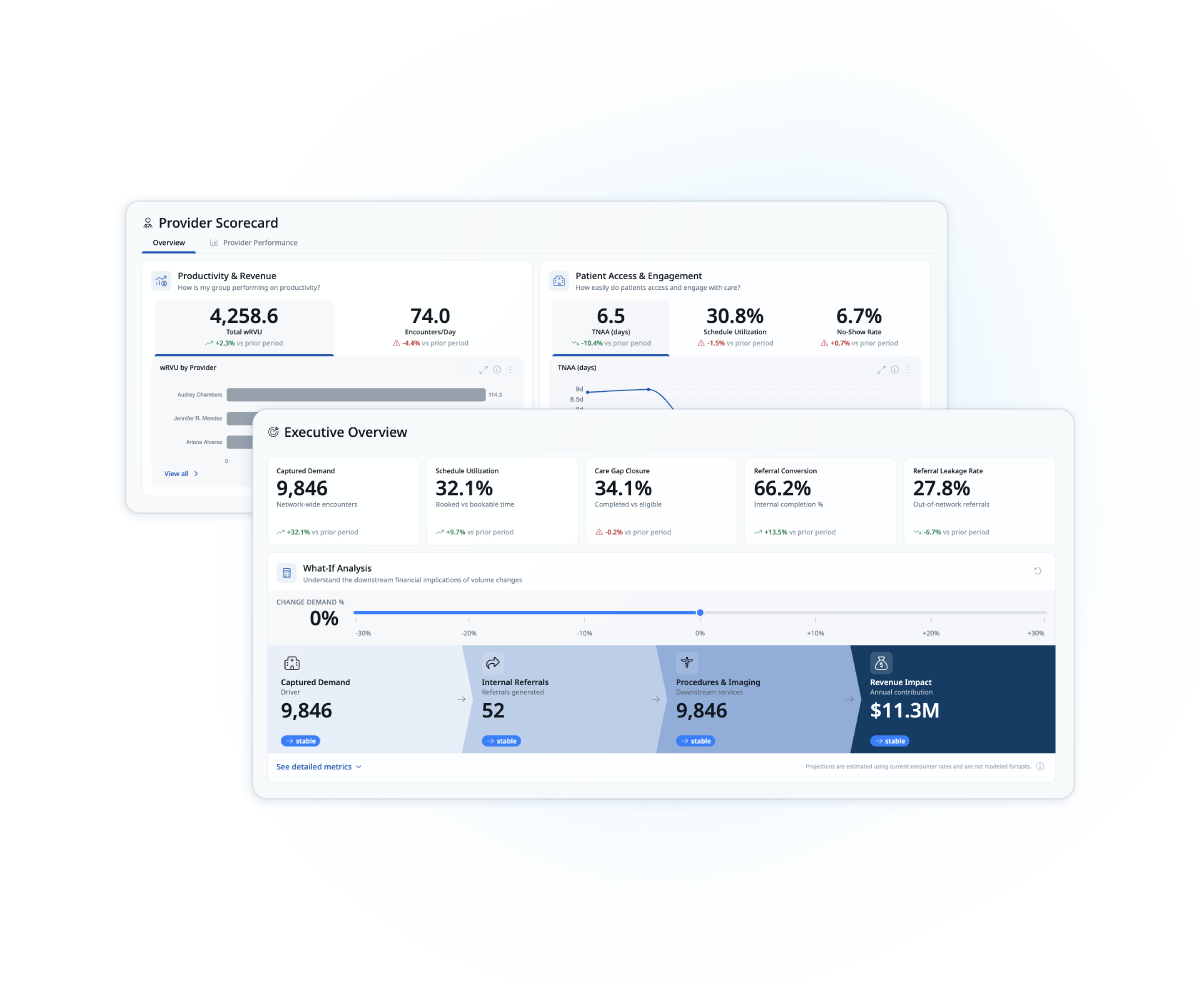
Two different roll-ups and breakdowns of numbers tailored to who’s in the room: the Executive Scorecard carries benchmarks, trends, and financial impact, while the Provider Scorecard shows productivity, access, and panel health, benchmarked against peers.
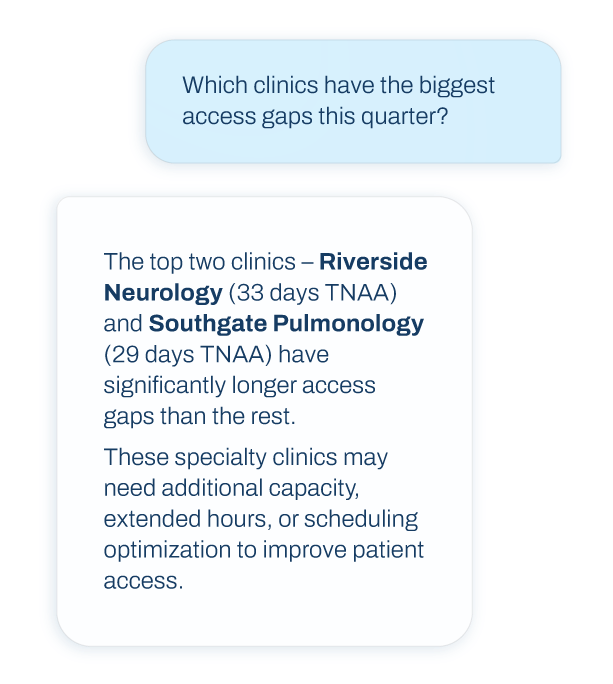
Natural Language Query
Ask it a plain question, "Where's the biggest opportunity in Orthopedics this quarter?", and get a real answer back. No dashboard to dig through, no analyst, no query to write.
It's built on the same data foundation behind every recommendation on this page, so the answer isn't a guess dressed up in confident language. It's something you can actually act on.

$25.4M
in additional revenue in year one

$2.2M
in additional revenue

$1.2M
revenue increase in one year
How we work with you
That's why our technology comes with people. A team of subject-matter experts work alongside your team — interpreting findings, deciding where to act first, and keeping leadership aligned on the same priorities. Your findings become what your team does Monday morning, and quarterly business reviews measure what changed and surface the next opportunity.

You've seen what Ambulatory Intelligence can surface — access delays, physician burnout, a growth number that's stalled. It pairs your own scheduling, billing, and referral data with an engine that ranks the opportunity, and the people who help you close it. Tell us where it's tightest, and we'll walk you through what that looks like in your own system.