Automating the Executive Healthcare Dashboard: Spend Less Time Collecting and Validating KPI Data

“We have been trying — unsuccessfully — for more than three years to improve the automation of our healthcare dashboards. Frankly, we didn’t think Health Catalyst could pull it off, but they did. We are moving steadily down the path of integrating the necessary data sources into our EDW.
A completely automated executive dashboard will enable the data stewards to own the quality of their data and my team to focus their expertise on quality improvement initiatives”
– Vice President, Business Intelligence
- Executives have an integrated view of more than 70 KPI measures, including operational, financial, quality, patient experience and other metrics
- Increased metrics automation by 25 percent
The core of any health system’s mission is improving health and ensuring quality and patient satisfaction. Healthcare executives are responsible for defining and tracking the key process indicators (KPIs) that indicate how well their organization is achieving this mission.
Many health systems have turned to an executive healthcare dashboard to monitor their performance against key measures. In fact, healthcare executives rely increasingly on such dashboards to provide a snapshot of their organization’s performance measured against established monthly and yearly targets.
Healthcare executives and other clinical decision-makers rely heavily on their business intelligence (BI) department and data analysts to collect, aggregate and report the needed data. But the creation of a dashboard can be a very time-intensive process. The fact is that many organizations are using Excel spreadsheets to “cobble together” these dashboards from a variety of sources.
Not only does this process tie up too many valuable staff members in manual work, but it also produces a static dashboard that has limited use as a business tool. These static dashboards lack the interactivity needed to help executives make sense of the numbers presented and often lack the context needed to understand how and where to implement change to drive better performance.
Such was the case at one large medical center. Challenged by this unsustainable manual workflow and static reports, this organization chose to leverage a healthcare enterprise data warehouse (EDW) and analytics technology to automate and improve the dashboarding process. The result of this effort is a streamlined, richer and more accurate executive reporting process.
THE CHALLENGE: “COBBLING TOGETHER” AN EXECUTIVE HEALTHCARE DASHBOARD
Committed to industry-leading care quality and performance, this medical center’s decision-makers — including the CEO, COO and vice presidents — hold monthly meetings to review healthcare KPIs and develop action plans to address any underperforming areas. Keeping up with these executives’ strategic information needs can be a considerable burden for the BI team and the owners of the data.
The process for creating the executive dashboard was structured as follows. Each month, data stewards — the owners of the data in various source systems such as the EHR, patient satisfaction and finance systems — would receive a request from the BI data teamfor the metrics associated with their particular system. These data stewards had various means of collecting and sending the information. Some would send the data in an email as text; others might send a spreadsheet as an attachment. In all cases, the BI team had to collect, aggregate and analyze raw data in various formats to cobble together the executive dashboard. Once the BI team had compiled and analyzed the data, they then had to send the reports back to the data stewards so that they could review the analysis and confirm the accuracy of the information. Finally, the BI department’s data team would have to work with their visualization team to transform the information into a graphical, easy-to-interpret PDF format.
This process was hampered by two significant problems:
- Poor use of time and resources
- The potential for inaccuracy
Time and Resources
Each month, the BI data team spent approximately five hours gathering data from the various data stewards and entering it manually into an Excel spreadsheet. Gathering this data was a tedious task that involved chasing down each individual who had responsibility for any piece of data that belonged in the dashboard. Especially at such a large health system where the sheer number of data points — 70 or more — that had to be gathered and analyzed was overwhelming.
The team would then spend an estimated 30 hours per month checking and validating the numbers and making changes and updates. This means that valuable personnel were spending much more time cobbling together reports than analyzing the data to glean actionable insights.
Data stewards were also pulled away from their primary responsibilities to meet executive reporting needs. Each data steward was not only responsible for conducting his or her own analysis of the data but also for double-checking the data after it was consolidated. And every time analysts had a question, they would have to reengage with the respective data steward — pulling that person’s attention once again away from important tasks. The entire effort added up to a significant number of hours for all involved in a cumbersome, back- and-forth process.
Potential for Inaccuracy
Throughout multiple steps in the process, the manual task of aggregating data introduced the potential for human error. Since the dashboard didn’t link to the source systems themselves, there was a possibility that the data would be transcribed inaccurately from one source to the next by data stewards and analysts. For this reason, the BI team was adamant that data stewards double-check the final report; however, this didn’t eliminate the risk of inaccuracy.
Both of these challenges were only exacerbated by ad hoc requests for data outside of the standing monthly meeting. The result was a frustrating, fire-drill-like atmosphere that pulled valuable resources away from their principal responsibilities.
THE SOLUTION: A SINGLE SOURCE OF TRUTH AND AUTOMATING THE DASHBOARD
The medical center had already deployed a healthcare enterprise data warehouse (EDW) from Health Catalyst to drive performance improvement initiatives. This EDW aggregates data from the electronic health record (EHR), financial systems, patient satisfaction systems and more to create an enterprise-wide, consistent view of all of the hospital’s data — a single source of truth to inform business decisions.
The BI team was able to leverage the existing EDW platform to begin automating the dashboard. The EDW feeds the dashboard, automatically integrating insights about population health management and patient satisfaction that are already being measured by other Health Catalyst applications running on the platform. This means that the EDW is now not only integrating data and enabling performance improvement for the health system but also helping to streamline operational processes.
HEALTH CATALYST EXECUTIVE DASHBOARD INTEGRATION TOOL
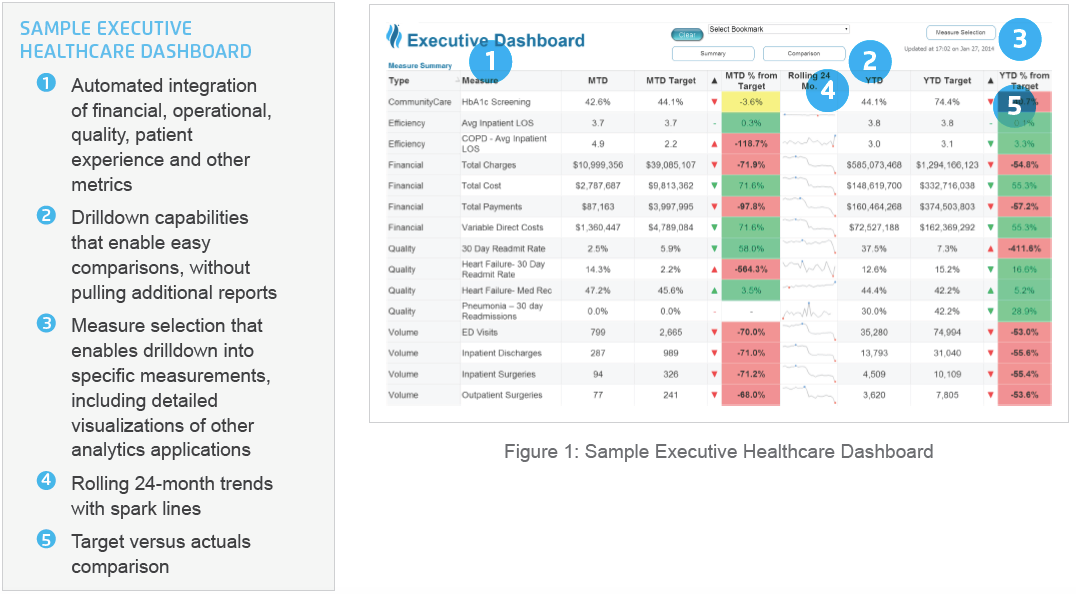
Health Catalyst offers an Executive Dashboard Integration Tool (EDIT) that enables integrated and customized views of KPI metrics sourced directly from the EDW. As shown in Figure 1 below, the Executive Dashboard provides a snapshot of the information in the EDW.
It integrates whichever KPIs each executive wants to see across multiple areas of accountability — including operational, efficiency, financial, quality, patient experience, volume metrics and more. The dashboard provides custom views, enabling executives to view the data for their particular business need. This also ensures sensitive data is only shared with individuals who have a business need.
Importantly, the dashboard does not provide a mere static view of current metrics. Rather, it delivers drilldown capabilities for exploring the data behind the summary metric. If executives want to drill deeper into the data, they are able to do so at the click of a mouse.

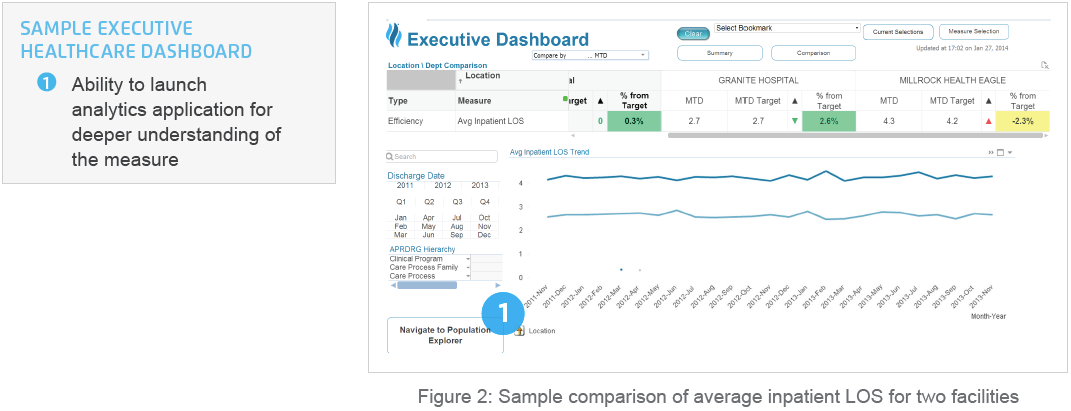
EDIT enables users to access additional metrics from the main dashboard by providing direct links to other analytics applications running on the EDW platform, such as the Population Explorer or Population Health Management applications (as illustrated in Figure 2). Executives can use filters to select locations, dates and measurements and to perform comparative analyses.

RESULTS: TIME SAVINGS THROUGH AUTOMATING THE EXECUTIVE DASHBOARD
With the EDW feeding the executive dashboard, executives have near real-time data available to them to inform strategic decisions, and analysts spend less time cobbling together reports. Here are the principal results of the dashboard automation effort to date:
Integrated Executive Healthcare Dashboard
The executive dashboard delivers an integrated view of more than 70 KPI measures, including operational, financial, quality, patient experience and other metrics. It displays trended actuals versus targets — including variance to the targets — and an easy-to-use, color-coded assessment of comparison to targets.
Increased metrics automation by 25 percent
The health system is in the process of integrating more source marts from the EDW to the dashboard. Thus far, they have increased the automation of the dashboarding process by 25 percent. This means that analysts spend a quarter less time each month collecting, aggregating, validating data and building reports.
Furthermore, data stewards are no longer required to send and validate all data manually.
Direct linkage to the EDW
The healthcare dashboard pulls data from the EDW for integrated data marts (e.g., heart failure) — which, again, saves time for both data analysts and data stewards. This direct link also improves data quality, because it eliminates the possibility of manual error as data stewards and analysts move the data from source system to email, from email to Excel spreadsheet. Data stewards help manage their analytics applications, ensure data quality is maintained and perform their own analyses. They take ownership for their data. Additionally, the data is timelier since the applications feed directly into the Executive Dashboard.
WHAT’S NEXT
The medical center is steadily working to integrate more source systems into the EDW platform for use in the integrated Executive Healthcare Dashboard and in current and future performance- improvement initiatives. As these source systems are integrated into the EDW platform, the ability to automate the healthcare dashboard will expand. Furthermore, as executives request new metrics, they can easily be added to the EDW platform and the executive dashboard. The health system is also working to enhance dashboard visualizations to deliver more in-depth information to executives at a glance.
ABOUT HEALTH CATALYST
Health Catalyst is a mission-driven data warehousing and analytics company that helps healthcare organizations of all sizes perform the clinical, financial, and operational reporting and analysis needed for population health and accountable care. Our proven enterprise data warehouse (EDW) and analytics platform helps improve quality, add efficiency and lower costs in support of more than 30 million patients for organizations ranging from the largest US health system to forward-thinking physician practices. Faster and more agile than data warehouses from other industries, the Health Catalyst Late- BindingTM EDW has been heralded by KLAS as a “newer and more effective way to approach EDW.”
For more information, visit, www.healthcatalyst.com, and follow us on Twitter, LinkedIn, and Facebook.
Read More About This Topic:
To Build or To Buy a Healthcare Enterprise Data Warehouse? A Health System Experience (Case Study)
This website stores data such as cookies to enable essential site functionality, as well as marketing, personalization, and analytics. By remaining on this website you indicate your consent. For more information please visit our Privacy Policy.