Automating and Integrating Patient Satisfaction Data to Achieve IHI Triple Aim Goals

- Integration of patient satisfaction into quality improvement initiatives
- Operational savings from eliminating outsourcing
Patient satisfaction has become a strategic focus for healthcare organizations across the country. Improving patients’ experience with care is, after all, one of the three pillars of the Institute for Healthcare (IHI) Triple Aim, and patient satisfaction/experience is now an integral part of CMS’ efforts to reform healthcare in the United States.
As a principal driver of reform, CMS has tied a percentage of Medicare reimbursement to value-based purchasing bonuses. These bonuses are primarily determined by adherence to clinical guidelines and outcomes—but a third of the bonus is based on scores from surveys that measure patients’ perceptions about the quality of their care.1
In fact, it is now a regulatory requirement for hospitals and ambulatory providers to conduct a Consumer Assessment of Health Providers and Systems (CAHPS) survey. In addition to CAHPS surveys, many organizations also rely on the LTR—or “likelihood to recommend”—metric to measure performance. A patient’s willingness to recommend a provider to friends and family is widely viewed as a leading indicator of satisfaction.
While measuring patient satisfaction has become increasingly important for organizations seeking to improve quality and maximize reimbursement, using patient satisfaction data effectively presents a variety of challenges. Organizations must collect the data, distribute it to multiple audiences and integrate it with data from other sources—efforts that often consume significant time and resources.
One large, internationally renowned health system was determined to tackle these challenges. Its goal was straightforward: not only to automate the patient satisfaction reporting process but also to create an analytics foundation that would integrate patient satisfaction into the organization’s overarching quality and cost improvement initiatives.
THE CHALLENGE: MANAGING PATIENT SATISFACTION DATA EFFECTIVELY
The health system’s efforts to measure and improve patient satisfaction had been hampered by complex and inefficient manual reporting processes. Data analysts would have to manually pull data from the patient satisfaction system vendor’s portal on a regular basis. They extracted raw data files for at least nine different service codes—such as medical practice, inpatient, emergency department, outpatient and behavioral inpatient—to create the report. These analysts would also have to manually aggregate LTR data. All of the data would then have to be cleaned up and visualized in a dashboard form before being distributed across the health system.
This monthly manual effort was considerable. Over time, the data analysts developed a semi-automated process, but the result was still an inefficient process. The time and effort required was compounded by frequent requests for custom and one-off reports. The analyst team also spent several hours per month on one-off XML requests and custom pulls.
Aware that its data analysts were overtaxed with manual work, the health system contracted with a third-party vendor to cobble together the dashboard for them; however, this contract failed to alleviate the burden sufficiently. Data analysts were still required to extract data and send it to the vendor to create the report. And they invariably had to clean up data errors once they received the dashboard from the vendor.
This problem of manual work was compounded by the need to use patient satisfaction data for quality improvement initiatives. Multidisciplinary quality improvement teams at the health system needed to integrate this data with clinical, financial and operational data to get a more holistic view of outcomes. However, robust analyses that included patient satisfaction data were cumbersome and therefore uncommon. Such analyses involved manually lining up patient identifiers in the disparate data and then rolling up the results.
THE SOLUTION: AUTOMATION OF PATIENT SATISFACTION DATA
The health system had already deployed a healthcare enterprise data warehouse (EDW) from Health Catalyst to drive performance improvement initiatives. This EDW aggregates data from the electronic health record (EHR), financial systems and more to create an enterprise-wide, consistent view of all of the health system’s data—a single source of truth to inform business decisions.
The health system and Health Catalyst added patient satisfaction data to this existing EDW platform by simply creating a patient satisfaction data mart. Using this data mart—which aggregates and minimally transforms data for analytics use—the health system is able to not only automate its reporting but also make the satisfaction data available to other analytics applications without requiring any manual input.
HEALTH CATALYST PATIENT SATISFACTION EXPLORER
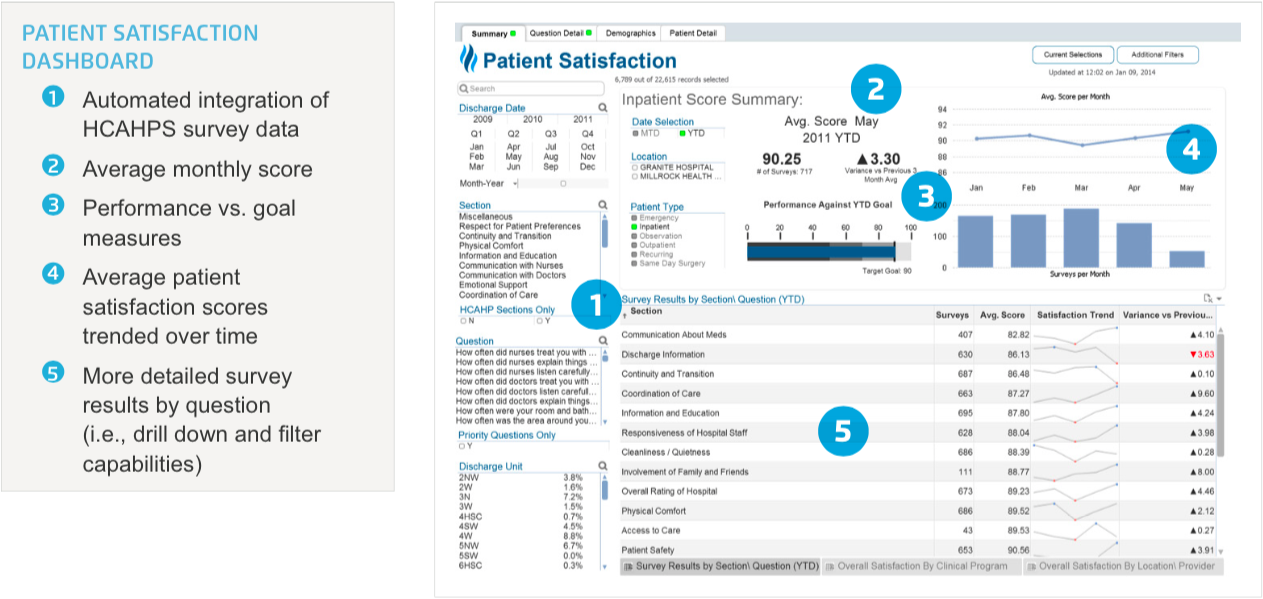
One Health Catalyst application that runs on the EDW platform is the Patient Satisfaction Explorer, which delivers integrated and customized views of patient satisfaction scores. Customization includes the ability to filter the data by several variables (e.g. location, clinical program, provider, etc.) to understand major drivers behind patient satisfaction trends. This functionality eliminates the need to manually create reports with different views depending on individual preference.
The Patient Satisfaction Explorer’s summary tab (Figure 1) shows average score, score trend over time and results by survey section:

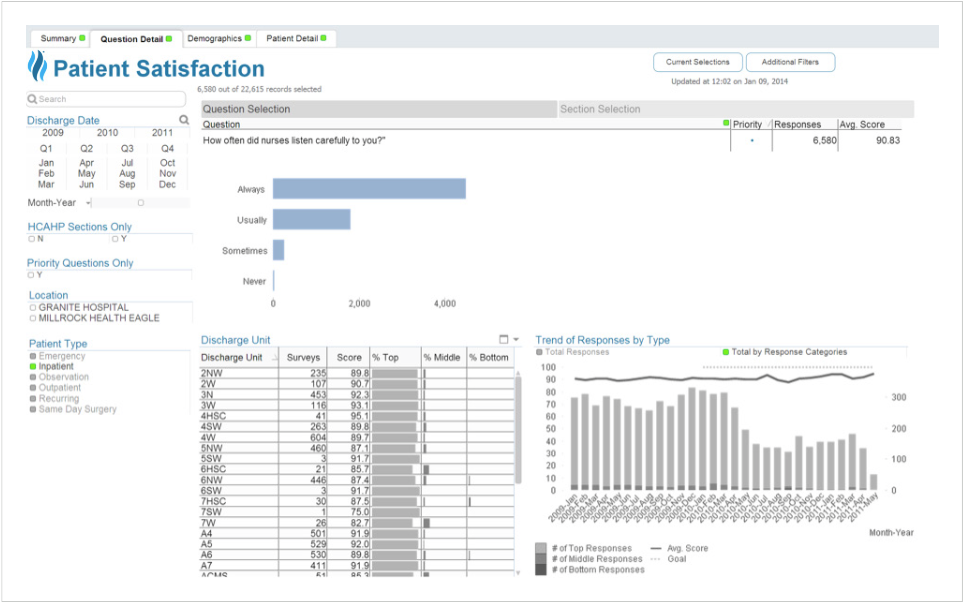
The application also enables users to drill down further into the survey data. For example, the “Question Details” tab shows where a user is examining the details behind the data for the question “How often did nurses listen carefully to you?” (Figure 2). Other details that users can drill down into include scores for a particular location, patient type, clinical program, specialty or provider to reveal what specifically is affecting scores.

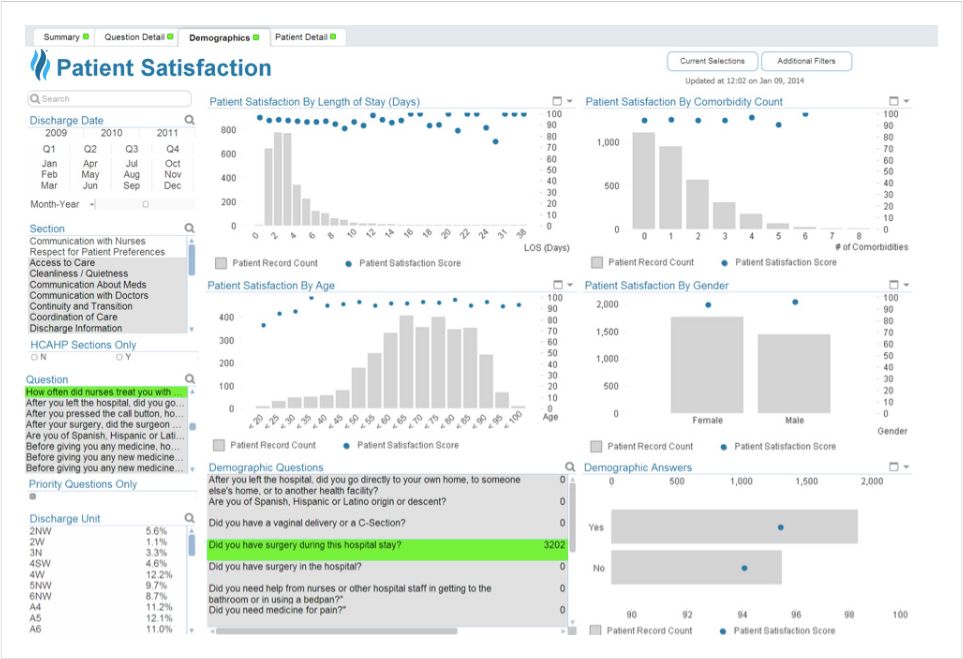
The application allows further slicing and dicing of the data through the “Demographics Tab”, where users can examine patient satisfaction results by different demographic or clinical markers such as LOS, comorbidity, age or gender. In addition, they can filter the responses according to a demographic question. In Figure 3, the user is analyzing the data for surgery cases by including only those patients who answered “yes” to the question “Did you have surgery during this hospital stay?”

RESULTS
Leveraging the EDW’s powerful data aggregation and analytics capabilities, the health system has significantly improved the effectiveness of its use of patient satisfaction data. Principal results of the initiative to date include:
Automated the patient satisfaction dashboard
The EDW has eliminated the need to manually pull and cobble together data to create a patient satisfaction dashboard. Rather, the dashboard pulls data automatically from the EDW. It then presents the data in the form of visualizations that enable each user to consume the information he or she needs. The data analysts are able to respond more quickly to one-off report requests by pulling the data from the EDW rather than performing manual data pulls.
Integration of patient satisfaction into quality improvement initiatives
The health system has successfully integrated patient satisfaction into many of its quality improvement initiatives. And because the patient satisfaction data can now be readily associated with individual patients and their clinical profile, the organization will easily be able to leverage patient satisfaction for all subsequent initiatives.
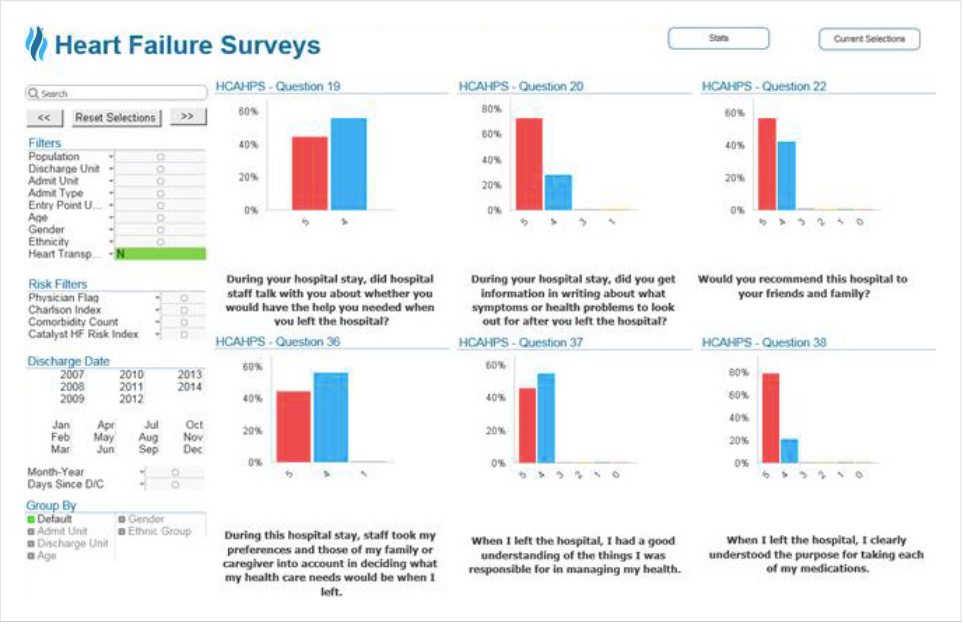
One example of a quality improvement initiative that is now benefiting from integrated patient satisfaction data is heart failure (HF) care. The health system has been using the Health Catalyst Population Health – Heart Failure Advanced Application to drive a variety of initiatives focused on improving HF care. Integration of the patient satisfaction data enables the quality improvement teams to analyze interventions, such as medication reconciliation, with their patient experience results. For example, they can examine HF-specific patient experience questions, such as “When I left the hospital, I clearly understood the purpose for taking each of my medications” (as shown in Figure 4, below). The team uses patient experience data largely as a balance measure to ensure that interventions designed to improve quality are not having a negative effect on patient experience.

The teams can also use the data to perform additional analyses. For example, they can determine the correlation between patient satisfaction and length of stay: Do HF patients who stay a shorter amount of time have higher satisfaction scores? They can also analyze satisfaction levels and readmissions: Is there a correlation between how HF patients answer certain HCAHPS questions and the likelihood of readmission?
Operational savings from eliminating outsourcing
Using the EDW, the health system is now able to conduct quality improvement analyses that involve patient satisfaction data entirely in house. This not only saves outsourcing costs; it also enables the health system to keep all of its data within the organization.
“Integrating patient satisfaction data into our quality improvement initiatives is helping us measure the impact of our interventions with more precision. Now that we have patient satisfaction data in our EDW, we can see how the changes that we make to improve quality affect our patients’ experience.”
– VP, Business Intelligence
WHAT’S NEXT
Consumers are demanding more transparency. To meet this demand, the healthcare system is moving toward sharing patient satisfaction results and provider reviews on its website. The Health Catalyst patient satisfaction data mart will interface with the organization’s public website to update this information automatically on the back end. The organization will continue to leverage their integrated clinical, financial, operational and patient satisfaction data to gain new insights about their patient population and to support quality improvement initiatives.
REFERENCES
Outreach and Education/Medicare Learning Network MLN/Hospital VB Purchasing Fact Sheet ICN907664, U.S. Centers for Medicare & Medicaid Services.
ABOUT HEALTH CATALYST
Health Catalyst is a mission-driven data warehousing and analytics company that helps healthcare organizations of all sizes perform the clinical, financial, and operational reporting and analysis needed for population health and accountable care. Our proven enterprise data warehouse (EDW) and analytics platform helps improve quality, add efficiency and lower costs in support of more than 30 million patients for organizations ranging from the largest US health system to forward-thinking physician practices. Faster and more agile than data warehouses from other industries, the Health Catalyst Late- BindingTM EDW has been heralded by KLAS as a “newer and more effective way to approach EDW.”
For more information, visit healthcatalyst.com, and follow us on Twitter, LinkedIn, and Facebook.
This website stores data such as cookies to enable essential site functionality, as well as marketing, personalization, and analytics. By remaining on this website you indicate your consent. For more information please visit our Privacy Policy.