✓ $4.7 million in cost savings
✓ 3.9% relative reduction in readmissions
✓ SIR < 1 for healthcare-associated infections


Optimize outcomes and drive measurable value with our Clinical Analytics Accelerators and expert services.


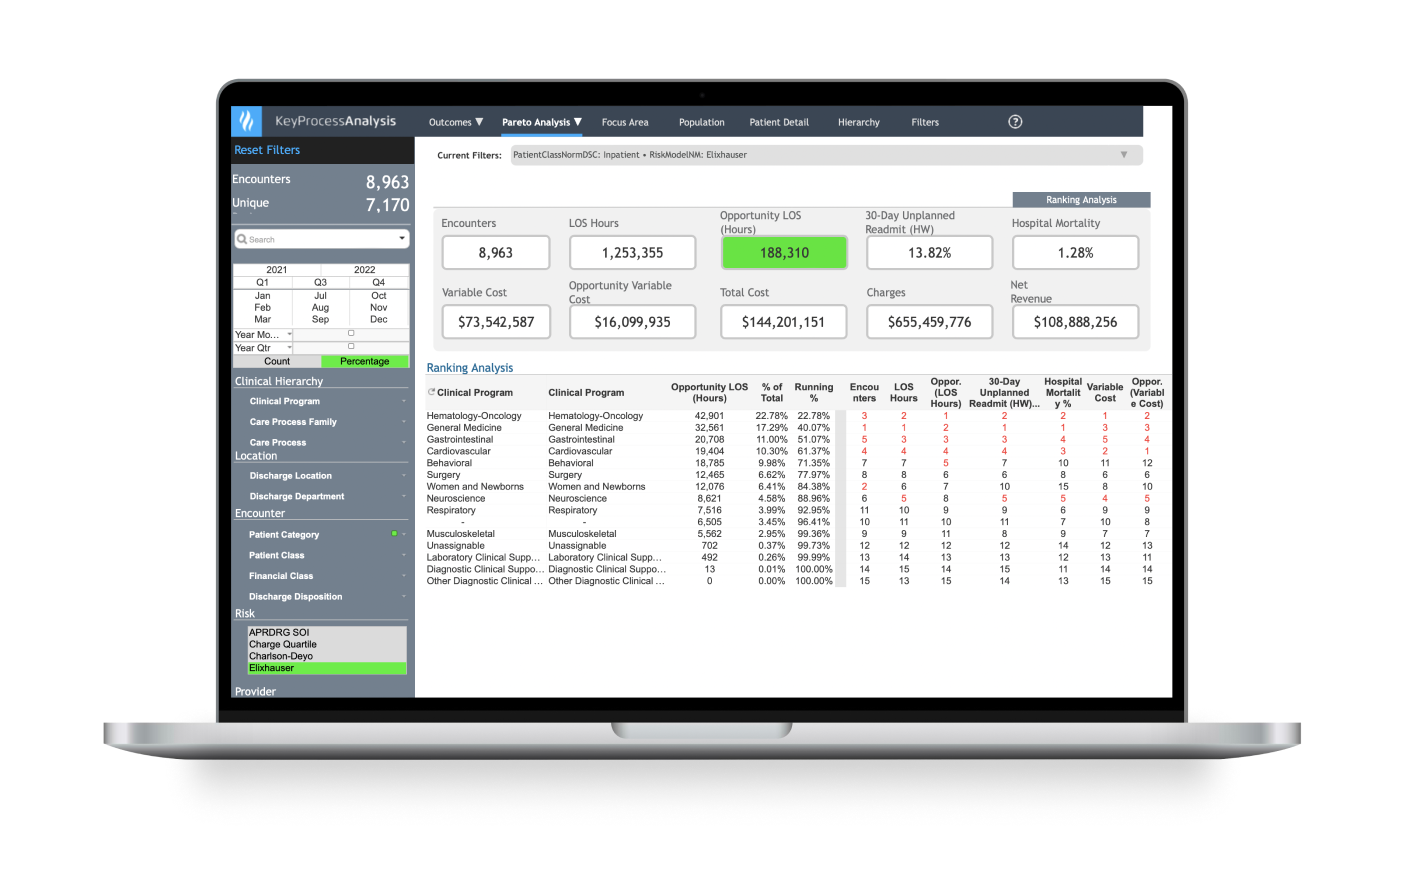
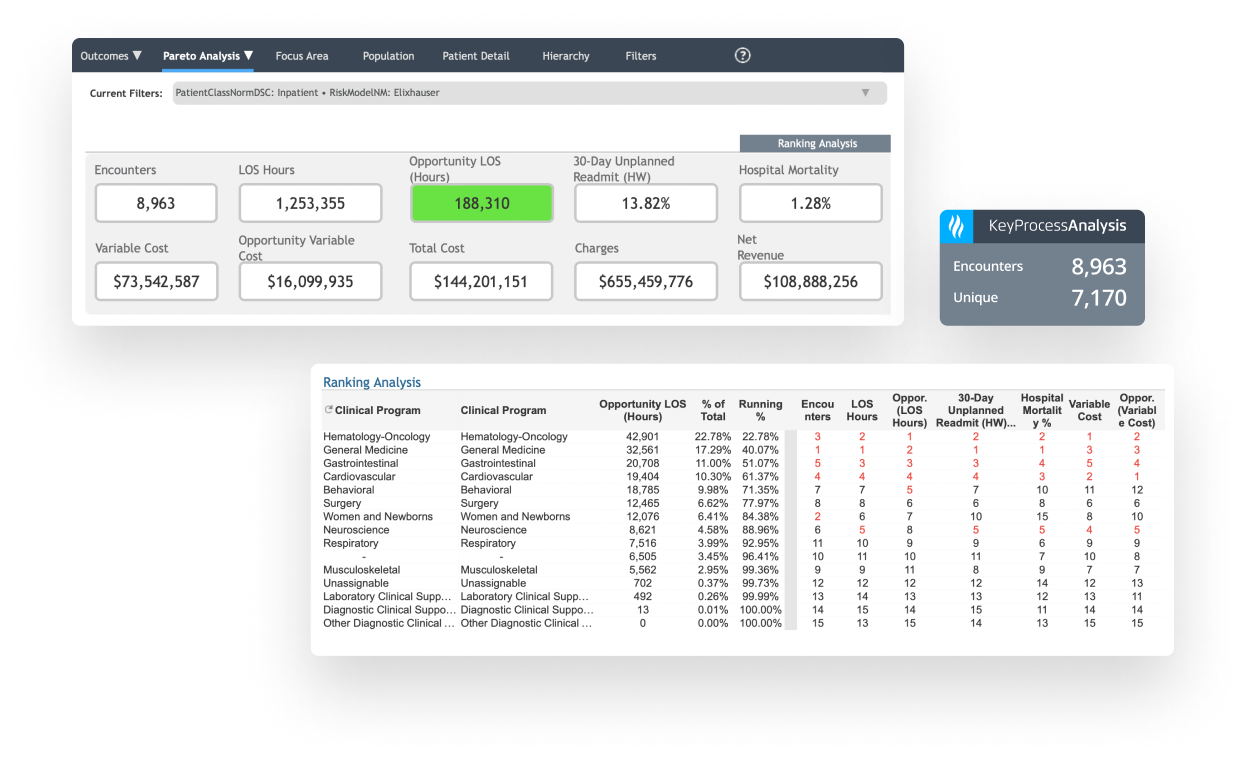
Identify high-cost, high-variation diagnoses to prioritize improvement work.

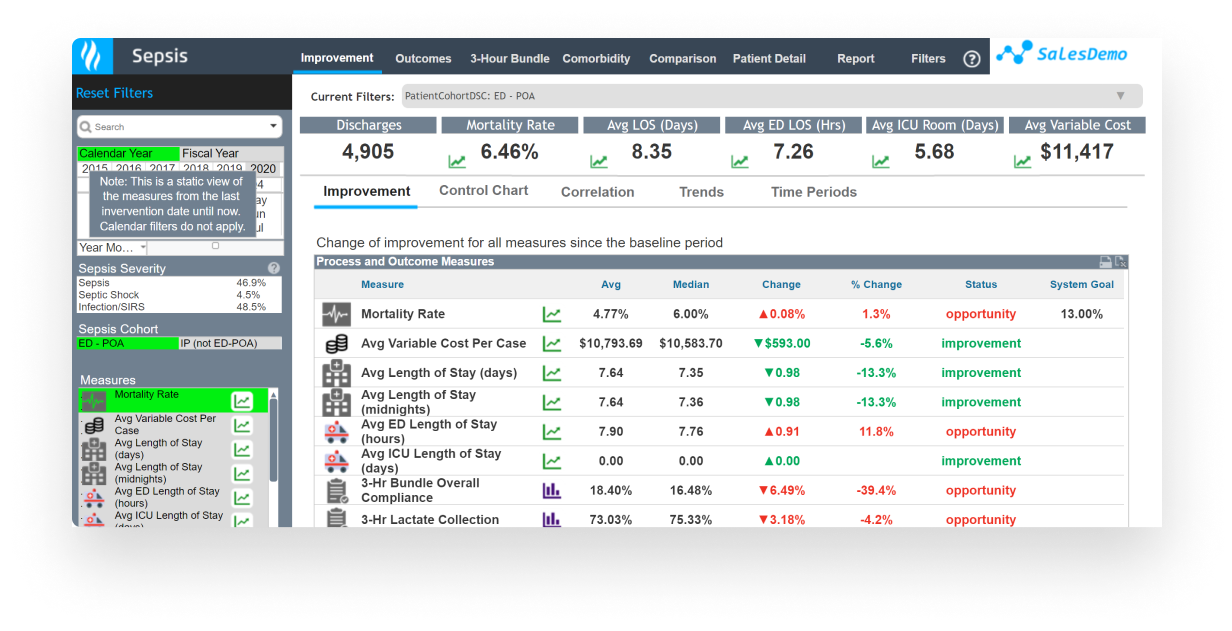
Use a patient-centered, evidence-based approach to quality improvement for:

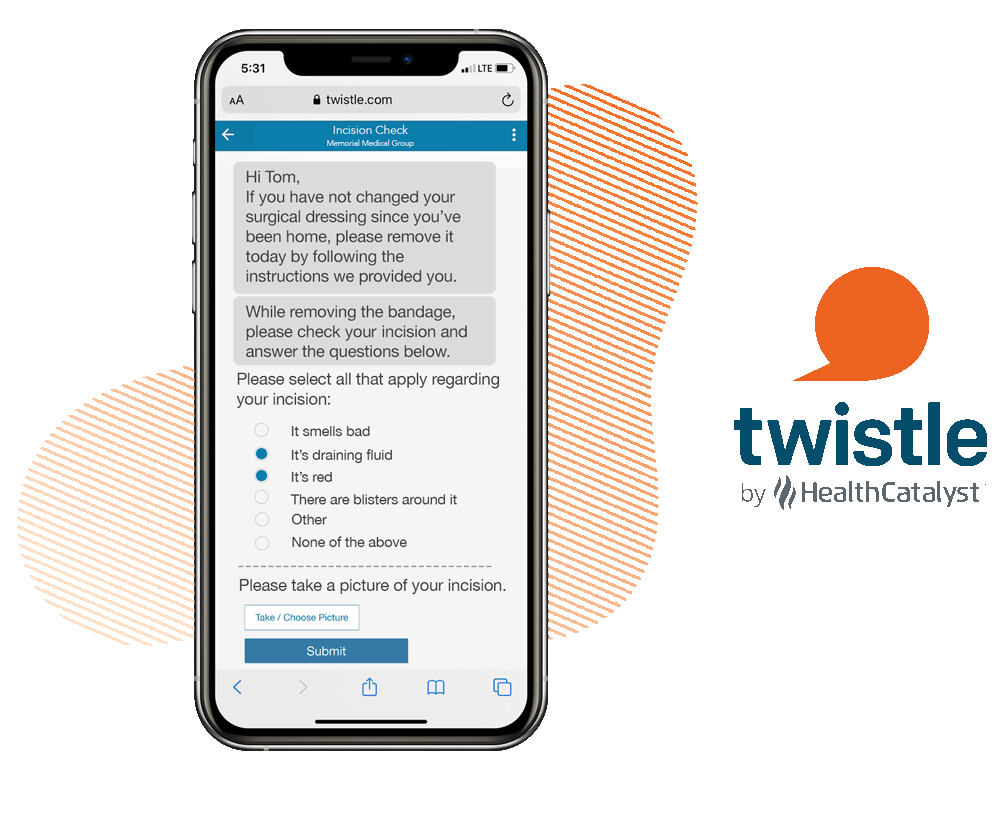
Deliver personalized guidance to your patients’ mobile phones to drive care plan adherence and increase satisfaction.

Streamline Clinical Registry Development and Data Management

✓ $4.7 million in cost savings
✓ 3.9% relative reduction in readmissions
✓ SIR < 1 for healthcare-associated infections


✓ 18% relative reduction in heart failure 30-day readmissions
✓ 10.9% relative lower cost of care
✓ 37.3% relative reduction in mortality


This website stores data such as cookies to enable essential site functionality, as well as marketing, personalization, and analytics. By remaining on this website you indicate your consent. For more information please visit our Privacy Policy.